
Repeal CEM; reform SA-CCR
Capital framework hurts clearing resilience, Citi execs argue

Regulators have given themselves two options for the calculation of capital requirements on cleared trades. One is far worse than the other, but both produce some bizarre outcomes.
Two steps are needed. First, US regulators should allow banks to abandon the near 30-year-old current exposure method (CEM); second, its mooted successor – the standard approach to counterparty credit risk (SA-CCR) – should be tweaked to make it a better fit for the clearing business. Under CEM, the viability of widespread clearing will be threatened; under the SA-CCR, its risk-reducing powers will be stunted.
To illustrate the weirder outcomes of each approach, the capital required for a 30-year interest rate swap by CEM is exactly the same as that for a five-year swap, although the risk, as represented by initial margin requirements, is roughly three-and-a-half times greater. When those trades start flowing into a portfolio, however, CEM’s limits on netting result in ever-expanding capital numbers.
The SA-CCR is an improvement, but can also generate odd outcomes. If a bank held enough initial margin to precisely offset the SA-CCR exposure number, for example, it would still have to hold capital equal to 60% of that exposure. The capital can be reduced significantly, but only via a massive expansion in margin.
Clearing members suffer most directly, but the system as a whole will end up bearing the cost – and the risk. To generate the returns required of the business, banks have a range of options, none of which are good for their clients. When the next crisis arrives, clients of a stricken clearing member would struggle to find a new home.
What is needed is a better method of calculating capital for cleared derivatives. This article analyses the problems with CEM and SA-CCR, and suggests some revisions to the latter.
Current exposure method
Under the CEM framework, regulatory capital for cleared derivatives portfolios is primarily calculated by measuring a derivative’s potential future exposure (PFE), which is determined by applying a multiplier to its notional amount. The multiplier is given in a grid that divides the market into seven product types and three buckets for remaining maturity.
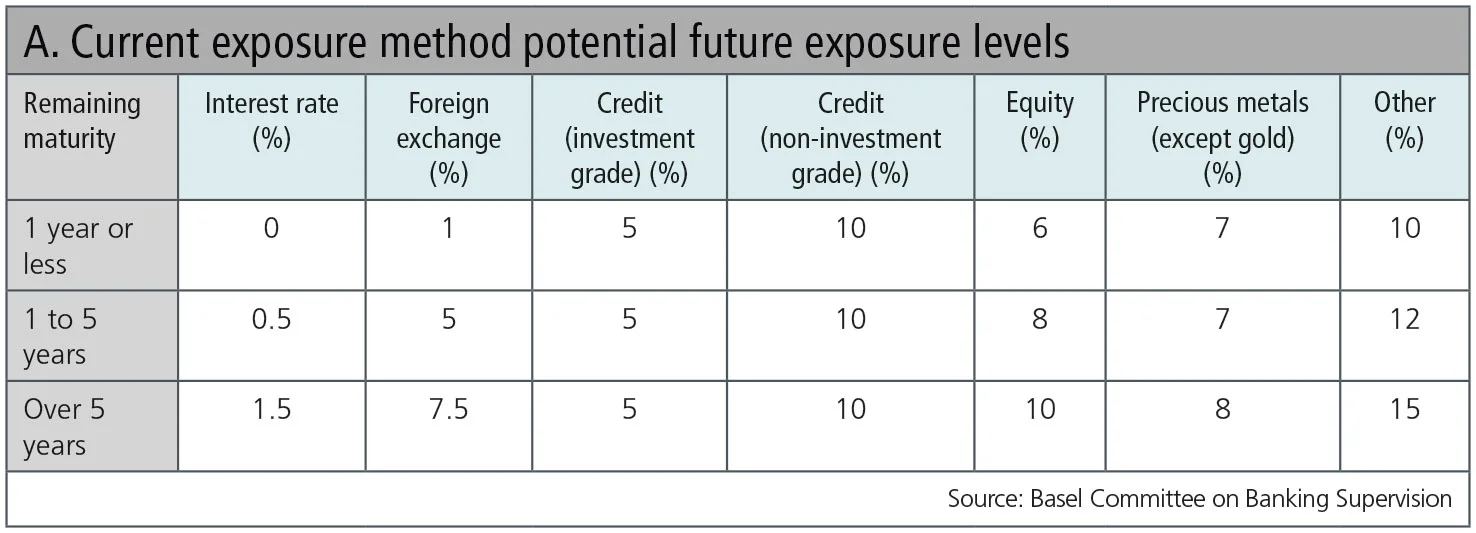
The CEM methodology allows for limited netting, since capital can only be reduced by a maximum of 60% for perfectly offsetting open positions.1
On the surface, a notional-based capital measure could have benefits when designing capital requirements for house activity in a centrally cleared ecosystem. A notional-based capital approach incentivises banks that act as market-makers to standardise the products they trade. In theory, if a market-maker executes and clears offsetting standardised trades via the same clearing house, notional is naturally compressed and eliminated – thus relieving the CEM-based capital burden.
However, when looking at CEM through the lens of a client clearer, a very different picture emerges. Client clearers operate in a ‘gross’ notional environment. Specifically, CEM is calculated at each client entity level. No netting, compression or reduction of notional is possible between different client accounts. Many clearers have thousands of accounts and manage vast amounts of notional. Unfortunately, this notional translates to capital, and high capital levels translate to low return ratios for client clearers. The rest of the system might not shed any tears about this, but if returns on the business are low, it jeopardises one of the cornerstones of central clearing – the ability to port positions from one clearing member to another in times of stress.
Overall, the CEM framework significantly overstates capital requirements for clearers relative to the underlying risk in the portfolios they clear for clients. The model’s lack of risk sensitivity misrepresents the capital requirements for many portfolio types and asset classes. Relative value, credit and commodities portfolios fare particularly poorly under the CEM approach. Conversely, the capital requirements for some portfolios are understated. A portfolio consisting of trillions of dollars of interest rate swaps with less than one year remaining in maturity would potentially not attract any CEM-based capital.
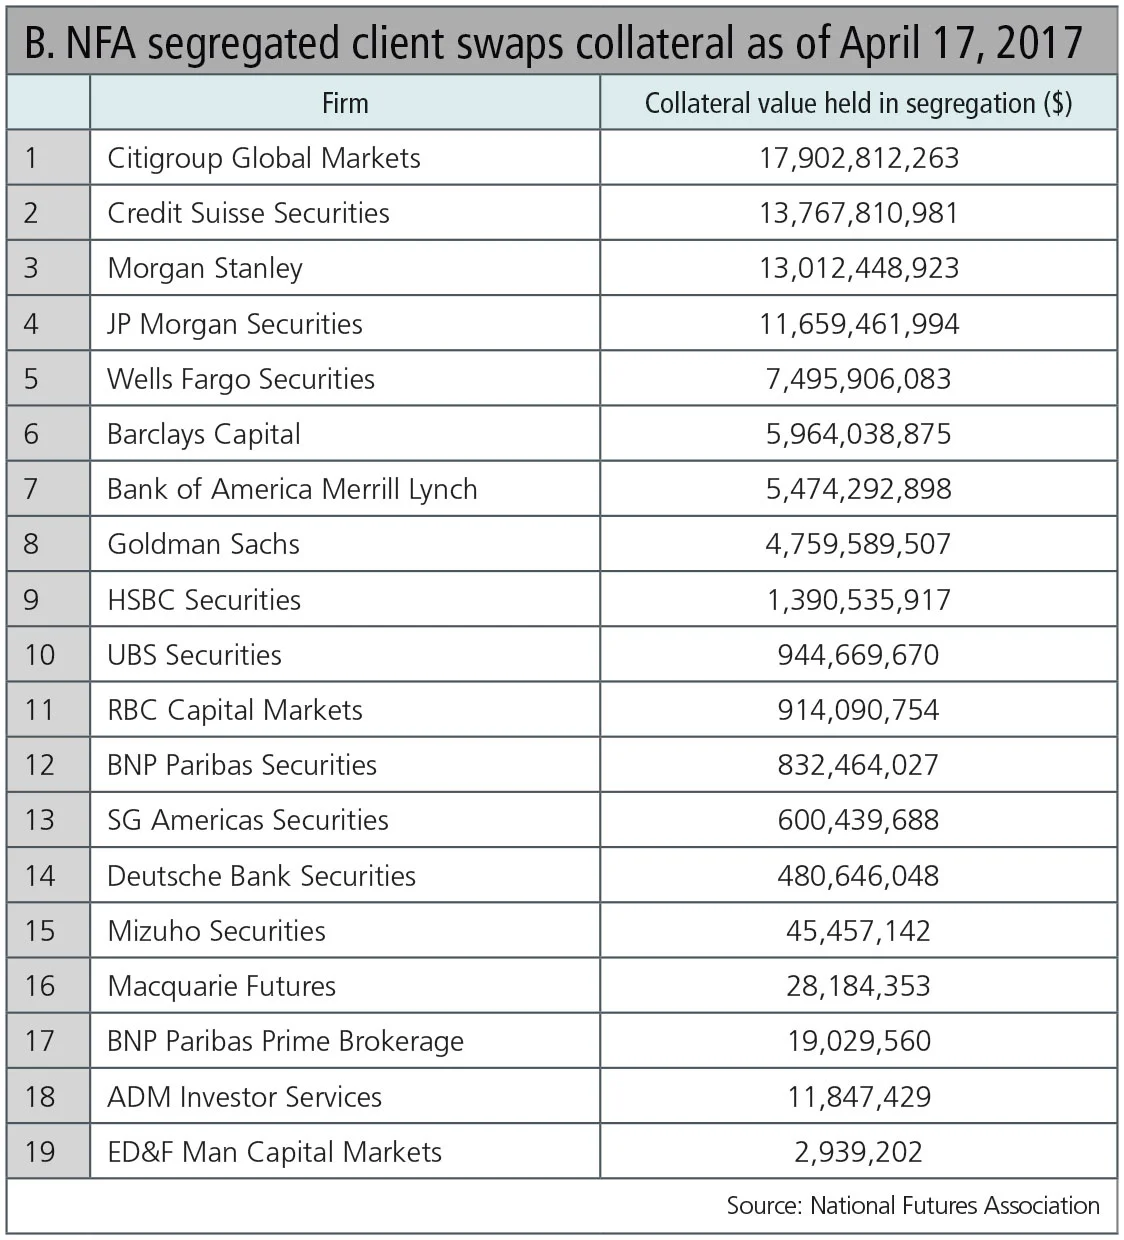
Though counterintuitive, overstated capital requirements may actually increase systemic risk in the context of central clearing by limiting porting opportunities. The population of swaps clearing intermediaries in the US – known as futures commission merchants – continues to contract, with clearing member concentration increasing. According to the National Futures Association, the top five swaps clearers held 75% of client funds as of April 2017, out of a total of 19 clearing firms.
Standard approach to counterparty credit risk
Notional-based capital methodologies, such as CEM, must be replaced with models that reflect the risk characteristics of cleared activity. In 2014, the Basel Committee on Banking Supervision signed off on SA-CCR, a standard, risk-based model intended to address the shortcomings of CEM. This methodology has been authorised in some jurisdictions outside the US and is now in the process of being implemented for designated capital calculations. While it provides a better foundation than CEM, the SA-CCR framework in its current form is only a partial solution; it must be further adjusted to reflect the realities of central clearing risk management for it to serve as a truly effective capital measure.
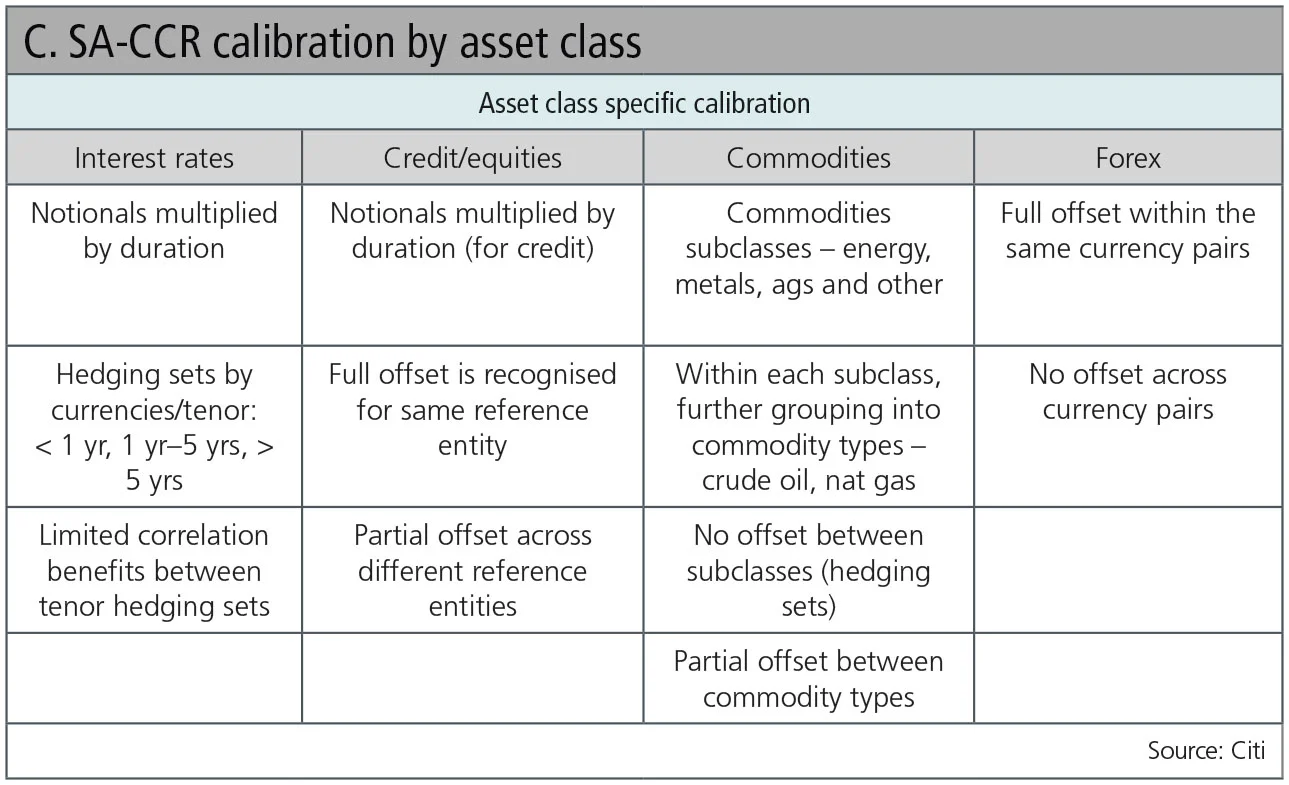
SA-CCR is a risk-sensitive framework that distills the concepts of advanced risk measurement into easier to implement formulas, and it provides effective netting between designated derivatives products that are grouped into ‘hedging sets’. SA-CCR also takes into account risk factors such as duration on interest rate swaps and delta for options, and differentiates volatility factors between ‘margined’ and ‘un-margined’ portfolios. Risk offsets are achieved though recognition of correlation benefits between defined hedging sets.
The main building blocks of SA-CCR are summarised in the chart below:

For each asset class, SA-CCR lays out specific rules for measuring exposure while providing limited correlation offset within designated asset classes.
CEM versus SA-CCR for clearing
In central clearing, risk is mitigated through robust initial margin levels, typically calibrated at a high confidence interval and a conservative liquidation horizon. Since both initial margin and regulatory capital are measures of underlying risk, one would expect to see a degree of consistency and correlation. However, when comparing CEM and SA-CCR outputs to initial margin levels on individual, centrally cleared trades by asset class, a different picture emerges.
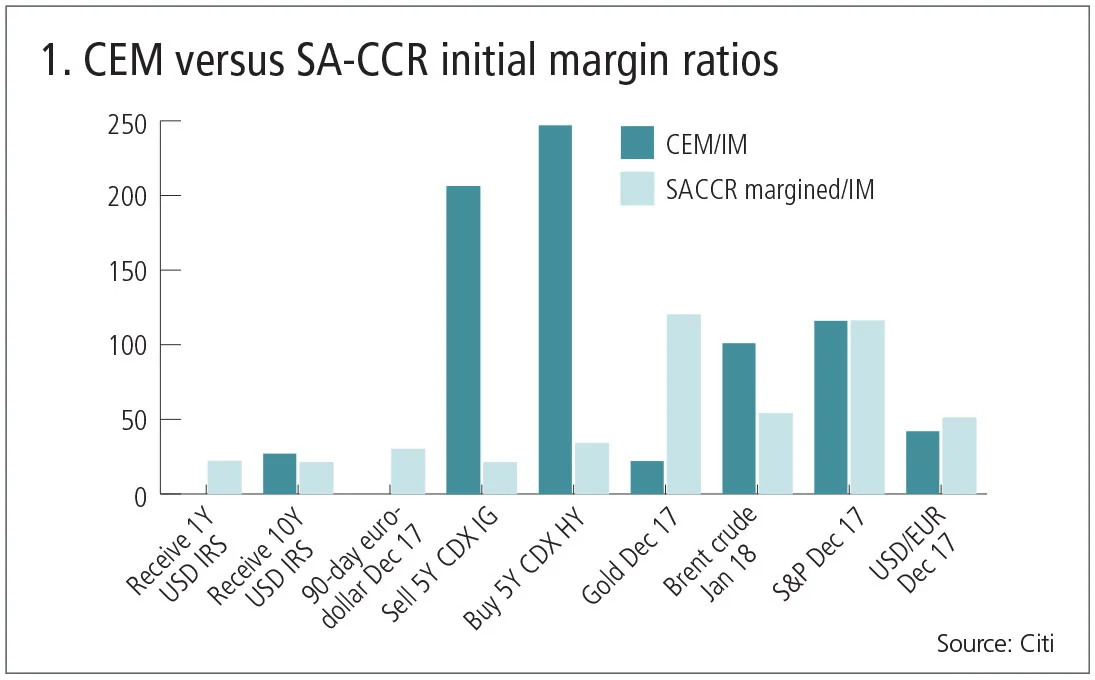
Figure 1 highlights the disjointed nature of CEM; it does not capitalise risk for short-dated interest rate contracts, while overcapitalising other products such as credit derivatives.
A deeper dive into a single interest rate derivatives exposure across various tenors reveals further dislocations between clearing house initial margin, SA-CCR and CEM methodologies. In the example below, it is clear that as tenor – and risk – increases, the SA-CCR and clearing house initial margin requirements also increase. Meanwhile, CEM maintains a rigid tenor bucket structure. It does not recognise any risk in the less-than-one-year residual maturity bucket or any differences in risk between the five- and 30-year tenor points.
When looking at both the CEM and SA-CCR exposures after considering the risk-reducing properties of initial margin, the initial margin required by the clearing house for this trade exceeds the CEM requirement, while SA-CCR does not fully recognise the risk-mitigating properties of initial margin.
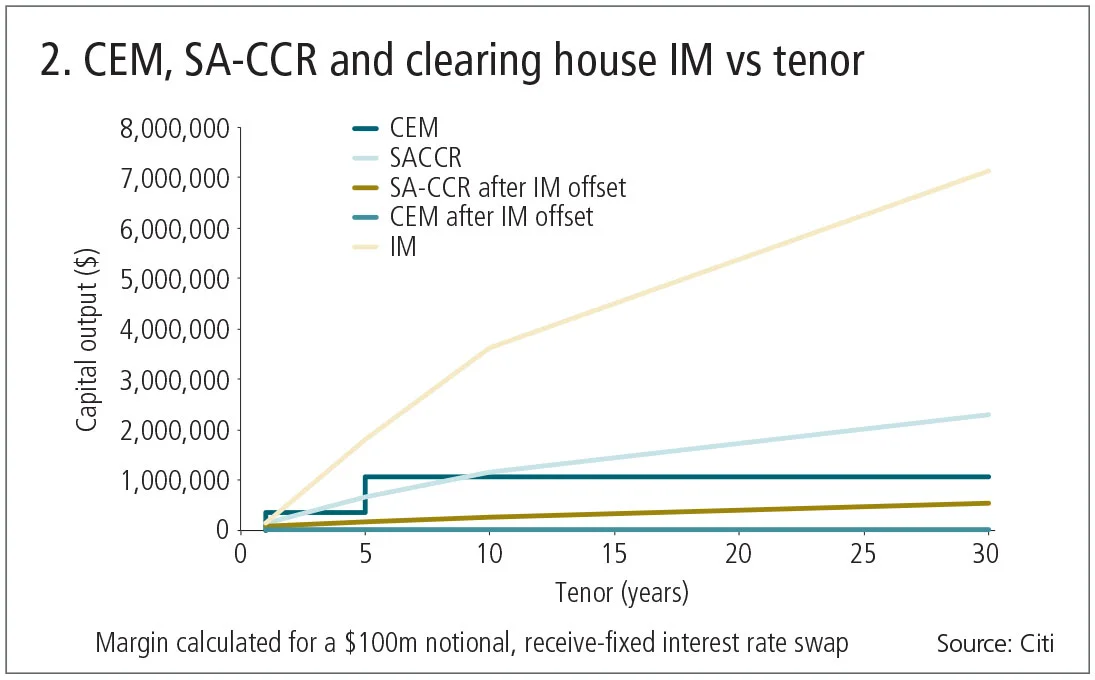
Since these graphs depict regulatory capital outputs for an individual trade only, portfolio effects are not taken into account. When notional builds in a portfolio, a very different picture emerges, and the differences between CEM and SA-CCR capital requirements become more profound.
Figure 3 shows the evolution of CEM and SA-CCR capital for a centrally cleared, interest rate swap portfolio, where underlying risk stays constant, but gross notional increases as offsetting positions are added in a simulated ‘roll’ scenario. This analysis was conducted on a vanilla receive-fixed interest rate swap with a notional of $100 million and five years until maturity. This position was ‘rolled’ and offsetting notional was added to keep the risk constant. However, no notional was netted or compressed. Since the risk remains unchanged as notional builds, the clearing house initial margin requirement remains constant for the portfolio.
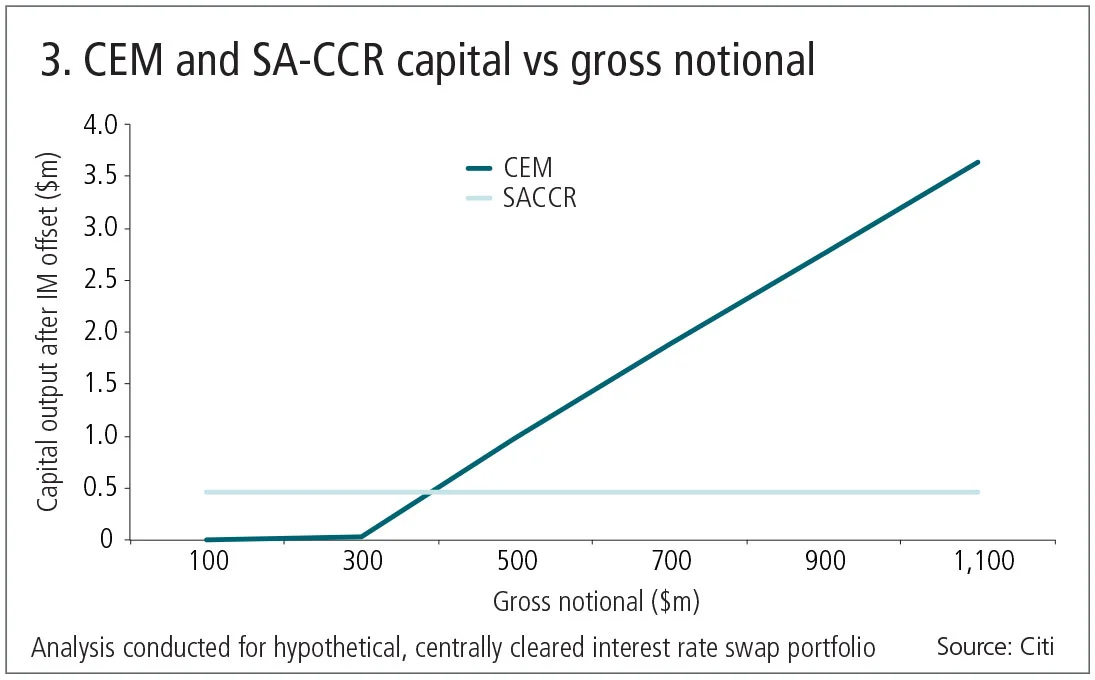
In this example, the clearing house initial margin requirement is sufficient to fully offset the CEM-based capital requirement until the portfolio’s gross notional surpasses $300 million. Since CEM recognises limited capital relief for offsetting trades within portfolios, the capital requirement explodes as notional builds beyond that point. Meanwhile, since both SA-CCR capital and clearing house initial margin requirements are based on underlying risk, the capital and initial margin requirements remain consistent as gross notional is added to the portfolio2. At $500 million in gross notional, the CEM capital requirement is twice that of the SA-CCR requirement. Putting this in context, LCH announced that it cleared $4.7 trillion in client notional for the week of June 30, 2017 alone3. Therefore, the huge notional size of today’s mandatorily cleared markets threatens significant CEM-based capital for clearers.
Unfortunately, as notional builds, the dislocation between CEM and clearing house initial margin requirements has a significant impact on clearing member return ratios. Risk-weighted assets (RWAs) – the base unit for bank capital ratios – recognise risk-reducing offsets for initial margin in cases where the clearing member has a legal netting agreement. Analysis of a balanced interest rate swap portfolio further highlights the challenges of CEM on clearing member returns.
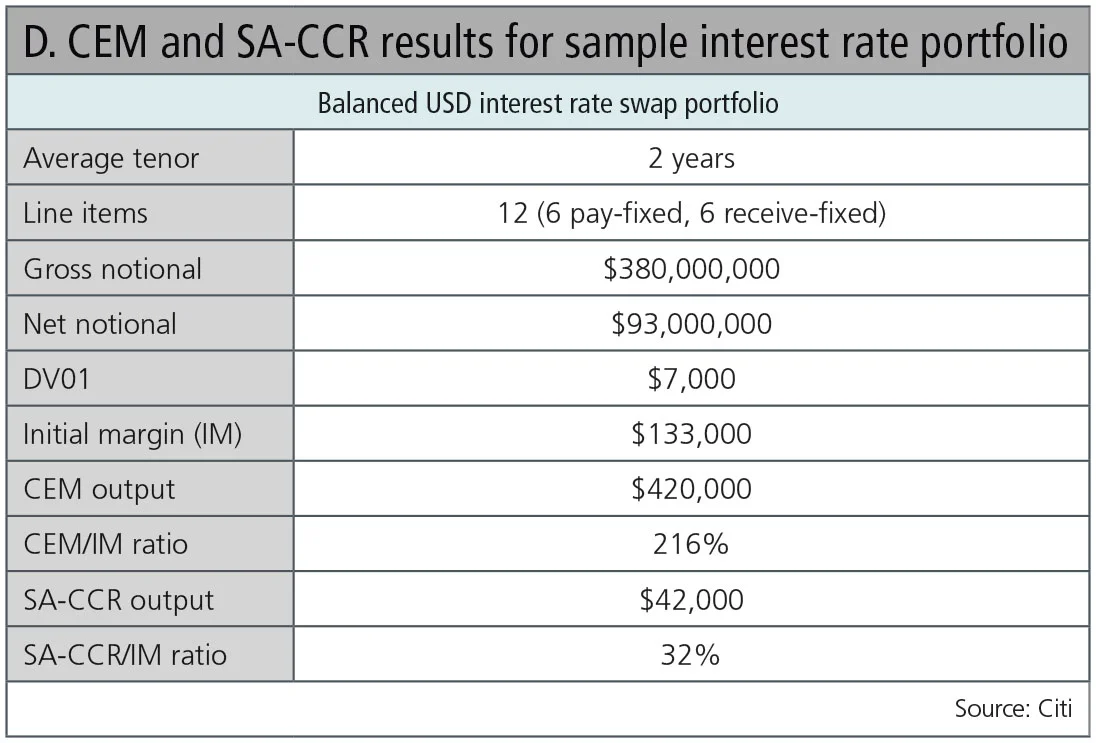
Table D shows CEM and SA-CCR capital exposures (after adjusting for the initial margin offset) for a balanced interest rate portfolio of 12 US dollar-denominated interest rate swaps. Similar to Figure 2, the CEM-based exposure significantly increases as offsetting notional builds and the regulatory capital outpaces the clearing house initial margin requirement. For this portfolio, when calculating RWAs, the CEM-based capital requirement ($287,000) is nearly seven times greater than the SA-CCR output ($42,000). Therefore, clearers would need to earn approximately seven times the revenue under CEM versus SA-CCR to achieve identical returns. Clearers unable to meet return ratios due to the challenges of CEM have several options to increase returns on RWAs. These optimisation options include the following:
- Increase revenue through significantly higher ticket fees or other client charges. For this portfolio, clearing members could charge fees that are seven times higher than would be required under SA-CCR to generate identical return ratios.
- Increase net income by reducing fixed and variable costs in an effort to improve the ratio of expense to revenue – the efficiency ratio. In some cases, clearers may be forced to eliminate, outsource or reduce aspects of their offering to save costs. While cost-cutting is an effective way of improving return ratios, the benefits are limited. For the portfolio in Table D, if one were to eliminate all expenses under CEM – an impossible task, of course – the RWA return ratios generated would remain inferior to those generated under SA-CCR, subject to a more reasonable efficiency ratio scenario.4
- Scale back or reduce business. Clearers may decide to only clear portfolios that work well under the CEM capital regime. Ironically, many of these are directional portfolios that could pose significant risk if markets dislocate.
- Increase initial margin. In addition to reducing notional, the return on RWAs may be improved by increasing initial margin. In the case of this portfolio, initial margin would need to be increased by 280% to align the CEM capital requirements with the SA-CCR-based RWA exposures.
As this portfolio demonstrates, regulators will potentially reduce the cost of clearing for clients by authorising SA-CCR for RWAs. Alternatively, if the CEM methodology prevails, clients may scale back their cleared derivatives activity instead of facing the punitive and costly optimisation options necessary to generate sustainable return ratios for clearing members. In some cases, this will result in reduced hedging and clients will simply decide to take more risk.
CEM-based capital also leaves clearers in a precarious position as they seek to achieve sufficient return ratios. Operations, technology, legal, compliance and other support infrastructure create large fixed costs for client clearing businesses. If clients migrate business away from a clearer or reduce cleared activity, net income and capital ratios are further affected since fixed costs stay constant while revenue departs with the client. Failure to achieve sufficient scale to offset fixed costs is fatal to clearing businesses, leaving clients with fewer choices and contributing to a market structure with more concentration.
SA-CCR – no panacea
In its current form, SA-CCR improves on many of the shortcomings of CEM. However, when analysing SA-CCR capital outputs on designated cleared portfolios, dislocations still emerge. SA-CCR would serve as a more thoughtful measure of clearing member capital with several adjustments. These reforms include the following points.
1. Full recognition of the risk-mitigating properties of initial margin
SA-CCR does not fully recognise the risk-mitigating impact of initial margin, and robust margining is the cornerstone of risk management in central clearing. When calibrating the level of risk offset permitted through initial margin, SA-CCR relies on an exponential function. As a result, the initial margin offset only provides sufficient reduction of exposure at very high multiples of margin to exposure.
As shown in Figure 4 below, a clearing member would need to collect approximately six times the SA-CCR exposure in initial margin to reduce the capital requirement by 91%. At a level where the initial margin collected equals the exposure under SA-CCR, because of the exponential formula applied, clearing members still need to hold capital against 60% of the calculated exposure. Finally, SA-CCR establishes a floor of 5% for the amount of offset provided by initial margin. Even at extreme levels of excess collateral, initial margin can only serve to offset 95% of the calculated exposure.
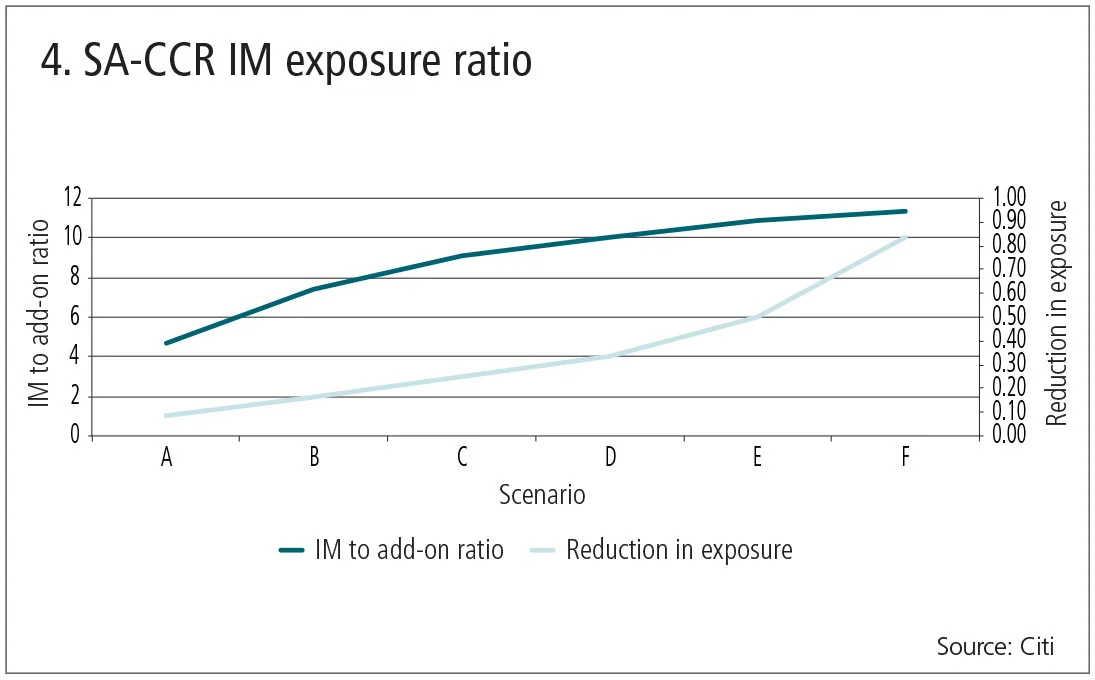
The current exponential formula used in the SA-CCR calculation was intended to capture fat tails – rare market moves that a normal distribution does not capture. In the central clearing context, however, the formula is overly conservative and punitive. Regulators should consider an alternative distribution, based on actual model results incorporating cleared margin requirements. Such an approach would capture tail risk sufficiently while allowing a higher level of initial margin offset. Further, the elimination of the 5% floor would better reconcile with central clearing design by fully recognising the risk-reducing benefits of initial margin.
Additionally, the current SA-CCR model does not differentiate between dynamic and static initial margin models. The supervisory factors used in the SA-CCR calculation are based on a stressed market environment, whereas initial margin in clearing house models has been shown to increase dramatically in times of stress. Hence, dynamic initial margin models used in clearing, which scale up as volatility increases and reduce counterparty risk, must be incorporated in a revised SA-CCR model. The dynamic nature of initial margin modelling has a material impact on the underlying risk and residual clearing member exposure. Therefore, it is imperative that this important risk-reducing feature of the clearing paradigm is not ignored in the regulatory capital outputs.
As seen in Table E, showing SA-CCR output of a sample cleared non-deliverable forward portfolio5, initial margin, calculated by the clearing house with a five-day liquidation horizon and 99% confidence interval, only offsets 40% of the capital required by the SA-CCR model.
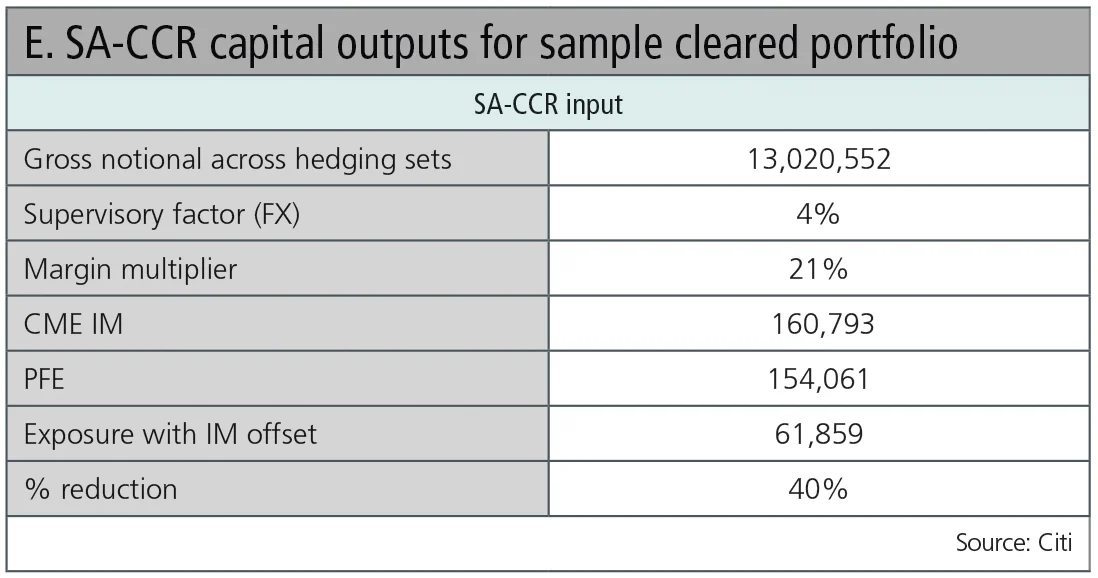
As expected, failure to fully recognise the risk-mitigating effects of initial margin has a negative impact on return-on-RWA for this portfolio.
2. Recognition of risk offsets for correlated products
SA-CCR does not recognise correlation and therefore any risk-reducing offsets between interest rate exposures in different currencies, interest rates and inflation swaps, or different currency pairs. For foreign exchange derivatives, SA-CCR also does not separate out currency legs to provide netting benefits for portfolios with overlapping currency pairs (for example, US dollar/euro versus Japanese yen/US dollar). Many clearing house margin models account for these diversification offsets by using portfolio historical value at risk (HVaR) methodologies. Even with these offsets, margin levels for over-the-counter derivatives are shown to demonstrate sufficient coverage during periods of market stress. Clearly, the SA-CCR model should be adjusted to recognise the full diversification benefits of these product types.
3. Appropriate time scaling of supervisory factors
In today’s SA-CCR model, add-ons for margined exposures are based on time-scaling of one-year risk horizon-based supervisory factors to a five- or 10-day time horizon. The simplistic volatility scaling approach in SA-CCR – relying on the square root of time – can overstate or understate risk for products that have auto-correlation. A separate table of supervisory factors for margined client exposures must be developed, based on a five- or 10-day risk horizon. Once again, this approach is more consistent with the CCP initial margin modelling approach.
4. Removal of the 1.4x scalar
Under SA-CCR, a scalar factor of 1.4 is applied to the model results for both RWAs and the supplementary leverage ratio to capture model risk, the correlation between exposures and default risk (wrong-way risk). The 1.4x factor was based on quantitative impact studies from 2003 and must be updated to reflect structural changes to market structure, including central clearing. Further, this factor was also meant as a crude measure to ensure the SA-CCR model was sufficiently conservative, despite already conservative supervisory factors. This approach to risk modelling must also be reconsidered to account for the realities of central clearing.
With this series of refinements, SA-CCR would more accurately reflect and capture the underlying risk in the clearing ecosystem, and therefore help to restore resiliency across the system.
In conclusion, the CEM methodology potentially increases systemic risk through its punitive impact on clearing members. Regulators must take timely action to introduce a more thoughtful framework that understands the unique characteristics of central clearing and restores resiliency to the system. While SA-CCR could serve as a baseline for this new framework, it must also be recalibrated to reflect the realities of the central clearing paradigm.
Trying to survive: how the market has responded to capital pressure
While hoping for regulatory relief, the industry has adapted to the challenges posed by the current exposure method (CEM) in various ways.
1. Product standardisation
By embracing standardised coupons and products, such as the revamped North American single-name credit default swap or the MAC swap – for market agreed coupon – market-makers can more effectively reduce notional exposure if they clear and ultimately compress offsetting trades at the same central counterparty (CCP). For client clearers, notional may be reduced by compressing equal and offsetting standardised products in the same underlying client entity only.
2. Reduction of rolls
This results in fewer contracts, additional standardisation and greater opportunities for compression of notional, especially in the context of central clearing. As per Table A, credit derivatives fare particularly poorly under the CEM regime. Thus, it is not surprising the industry has reduced roll periods from four to two times per year for many credit derivatives contracts.
3. Compression/coupon blending
CCPs and third-party vendors have invested in new capabilities to eliminate notional through compression algorithms and blending capabilities. Portfolio compression is a process by which multiple trades in a portfolio may be terminated and reconstructed with identical risk, but a reduced notional profile. Coupon blending is a process by which portfolios of trades with different coupons may be reconstructed by netting or ‘blending’ the coupons together, thus reducing notional, provided the other economic inputs of the offsetting trades align.
4. Settlement versus collateral
Under the CEM rules, capital calculations may be reduced by 1% of notional for interest rate swap trades with greater than five years to maturity if the variation margin of the trades settle and reset daily6. Based on Table A, interest rate derivatives trades of this maturity that ‘settle’ do benefit from a PFE reduction of 67% – delivering significant RWA savings. As a result, some CCPs have issued new rules or released new ‘settled-to-market’ contracts clarifying that variation margin settles the outstanding market value of a trade, rather than functioning as collateral. While some client clearers have implemented this approach, US clearers are awaiting prudential regulatory authorisation before implementing this Basel rule.
At Citi, Vijay Albuquerque is global head of in-business risk, futures, clearing and collateral, Jerome Kemp is global head of futures, clearing and collateral, Christopher Perkins is global head of OTC clearing and Mariam Rafi is North American head of OTC clearing
1 Under the CEM calculation, the ‘net to gross ratio’ (NGR) is the net current credit exposure to the gross current credit exposure. The gross current credit exposure equals the sum of the positive current credit exposures of all derivatives contracts subject to the qualifying master netting agreement. According to CEM, exposure amount (EA) = net current credit exposure + [(0.4 x PFE) + (0.6 x NGR x PFE)].
2 SA-CCR output remains constant because the increasing notional falls within the same ‘netting bucket’ set in this scenario.
3 LCH notification, ‘Weekly Volumes Update’. June 30, 2017.
4 The SA-CCR analysis assumed an expense-to-revenue ratio of 50%.
5 The sample portfolio consists of a mix of long and short cleared non-deliverable forward swaps, consisting of the following currencies: BRL, COP, INR, KRW, PEN and MYR.
6 Federal Register/Vol.78, No. 198, Friday, October 11, 2013; Rules and Regulations. Pg. 62183.
Only users who have a paid subscription or are part of a corporate subscription are able to print or copy content.
To access these options, along with all other subscription benefits, please contact info@risk.net or view our subscription options here: http://subscriptions.risk.net/subscribe
You are currently unable to print this content. Please contact info@risk.net to find out more.
You are currently unable to copy this content. Please contact info@risk.net to find out more.
Copyright Infopro Digital Limited. All rights reserved.
As outlined in our terms and conditions, https://www.infopro-digital.com/terms-and-conditions/subscriptions/ (point 2.4), printing is limited to a single copy.
If you would like to purchase additional rights please email info@risk.net
Copyright Infopro Digital Limited. All rights reserved.
You may share this content using our article tools. As outlined in our terms and conditions, https://www.infopro-digital.com/terms-and-conditions/subscriptions/ (clause 2.4), an Authorised User may only make one copy of the materials for their own personal use. You must also comply with the restrictions in clause 2.5.
If you would like to purchase additional rights please email info@risk.net
More on Comment
Responsible AI is about payoffs as much as principles
How one firm cut loan processing times and improved fraud detection without compromising on governance
Op risk data: Low latency, high cost for NSE
Also: Brahmbhatt fraud hits BlackRock, JP Morgan slow to shop dubious deals. Data by ORX News
Quantcast Master’s Series: Kihun Nam, Monash University
Melbourne-based programme winks at pension fund sector
How Basel III endgame will reshape banks’ business mix
B3E will affect portfolio focus and client strategy, says capital risk strategist
Why source code access is critical to Dora compliance
As Dora takes hold in EU, access to source code is increasingly essential, says Adaptive’s Kevin Covington
Quantcast Master’s Series: Petter Kolm, Courant Institute
The NYU programme is taught almost exclusively by elite financial industry practitioners
CVA capital charges – the gorilla in the mist
The behaviour of CVA risk weights at US banks in 2020 hints at the impact of the Basel III endgame
NMRF framework: does it satisfy the ‘use test’?
Non-modellable risk factors affect risk sensitivity and face practical and calibration difficulties, argue two risk experts


