

Harvesting the FX skew premium
Observing the vol-of-vol parameter may reveal a skew premium in FX markets
CLICK HERE TO DOWNLOAD THE PDF
In this note, Lorenzo Ravagli introduces theoretical innovation around the possibility of harvesting a skew-risk premium in the foreign exchange market and shares practical insights for investment decisions by portfolio managers. He leverages his previous research by showing that the vol-of-vol parameter is the key driver behind the skew premium, attributable to the interplay between implied and realised spot/vol covariances. New correction terms related to smile and term-structure effects are shown to improve the profit-and-loss interpretation significantly
Sources of decorrelated returns permit portfolios’ left-tail exposure to be reduced. ‘Risk premia’ strategies have become more widely included within multi-asset portfolios over the past decade, given the diversification benefit offered by the alternative strategies over their traditional, long-only counterparts.
The number of liquid assets within the options space is smaller, and diversification requires us to look for orthogonal sources of profit-and-loss (PnL) drivers across the tradeable assets. This task typically involves maximising the number of volatility parameters that allow a direct mapping via a viable trading strategy. A negative skew for equities has been a structural feature since the 1987 flash crash, with the academic literature pointing to a harvestable risk premium. Foreign exchange (FX) risk reversals drive the skewness of currencies’ risk-neutral spot returns but explain little of the skewness of future spot returns (Jurek 2009). Studies on the applications of these properties towards cross-asset investment decisions have been scarce.
We expand to the skew the results of previous reports by Ravagli (2015, 2022), covering the opportunities for investors arising from a risk premium on the vol-of-vol, with a focus on the FX market. A longer version of this article is available on SSRN (Ravagli 2024).
Isolating risk premia for the smile parameters
The technical nature of our topic requires some definitions, well known by options practitioners, which are introduced below. For a vanilla payoff with Black-Scholes price , where is the spot value, is the strike, is the implied vol of maturity and is the at-the-money (ATM) volatility with expiry , we introduce first-order Greeks:
and second-order Greeks:
via the sensitivities to , and . The PnL function of a delta-hedged option can generally be expanded as:
The expansion stems from an algebraic identity that breaks down the option’s Theta as the sum of the contributions from second-order Greeks by adjusting the breakeven parameters , , for vol, vol-of-vol and spot/vol correlation, respectively. These parameters depend, in principle, on the strike, maturity and composition of the portfolio, which prevents the aggregation of a portfolio’s risk exposures relative to its constituents, reducing the use of the expansion. Hence, what matters for trading purposes is the actual expression of the breakeven parameters, which require assumptions on the dynamics of spot and vol market variables. The smile near the money is expanded as (Bergomi 2009; Sepp 2010; Ravagli 2015):
where is the ATM vol of maturity and is the log-moneyness. For a purely diffusive process with a flat vol curve, considering zero rates and skew allows us to calculate the breakeven parameters for short (at order ) and (at order ) as (Ravagli 2015):
within a class of stochastic volatility models such as SABR (Hagan et al 2002) or Heston (1993), where is the implied vol-of-vol. Under these same limits, the breakeven spot/vol correlation parameter (, in agreement with the smile expansion) becomes:
where is the stochastic-volatility-implied spot/vol correlation parameter. This explicit calculation is fully consistent with the more general result of Bergomi (2009). The following expansion then holds:
The formula generalises the well-known Theta-versus-Gamma interplay:
The adequacy of the formula’s fit to data will be checked in the following sections. The expansion leads to a natural definition of the skew premium as:
Via the formula, the mismatch of spot/vol implied covariances versus realised covariances drives the PnL of a Vanna-sensitive position, making the former a tradeable quantity. The interplay of implied versus realised spot/vol correlations is not directly linked to the PnL function. The notion of a skew-risk premium has been covered in the literature via the skew stickiness ratio (Bergomi 2009), the breakeven skew (Sepp 2010) and skew swap payoffs (Schneider et al 2015), as well as the implied-versus-historical difference between the third moments of distributions (Hull et al 2022).
FX skew premium: empirical evidences
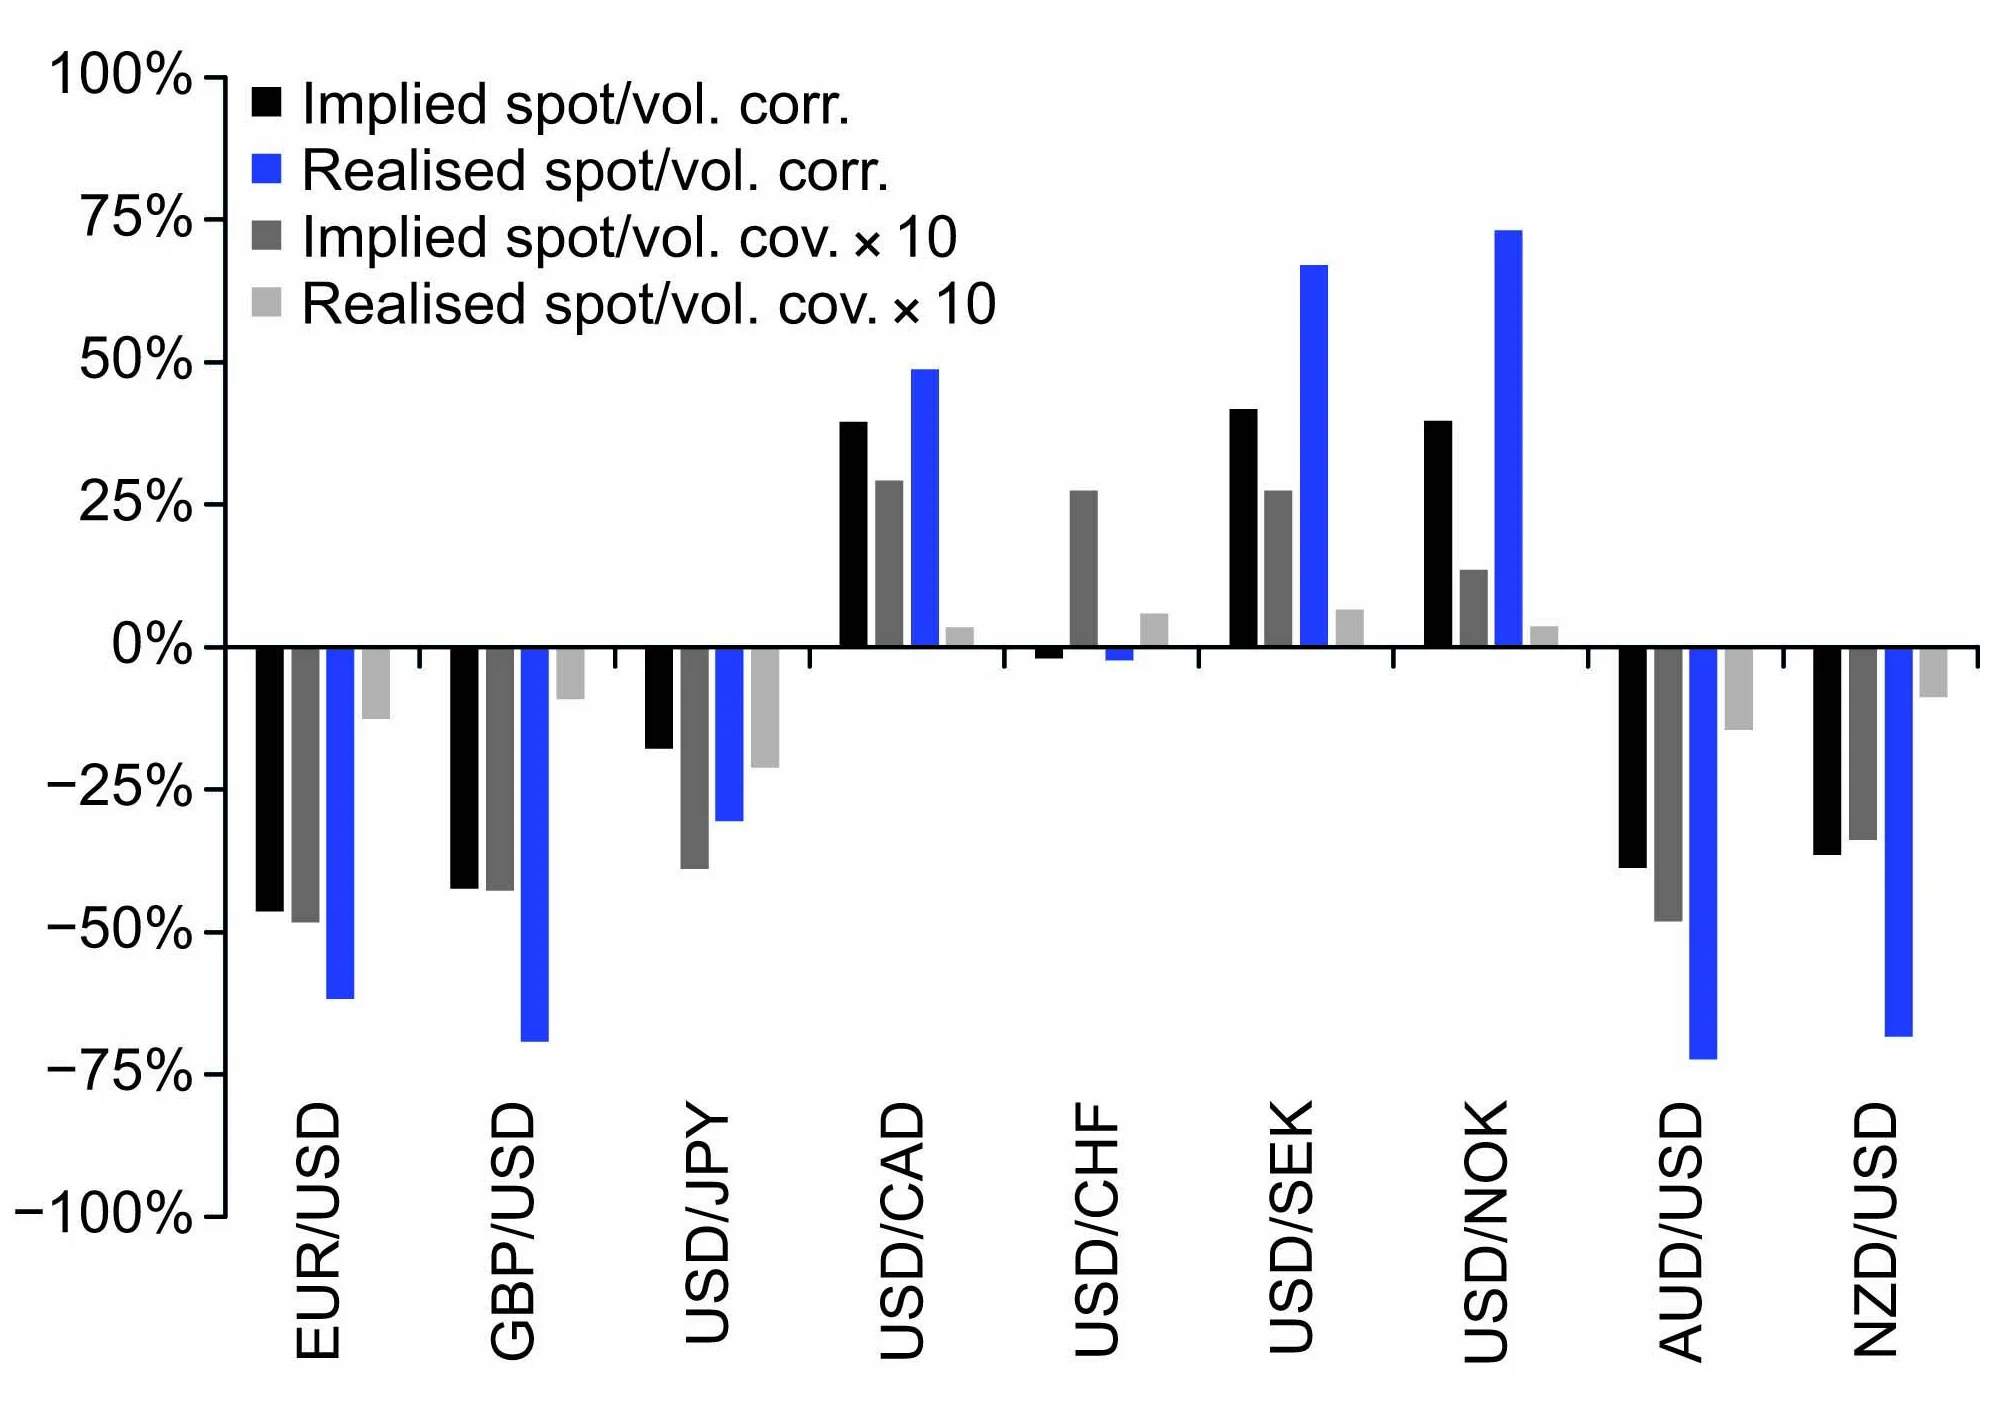
FX options practitioners often proxy the performance of skew-sensitive trades by comparing the implied and realised spot/vol correlations across pairs (figure 1); the two measures are ‘close’ to each other, with the realised estimate being the more volatile of the two. Throughout this article, all the displayed smile parameters stem from an SABR calibration. At the time of the analysis (July 2022), most realised spot/vol correlations exceeded (in absolute value) the implied measure, suggesting that long risk-reversal trades were being performed.
Measuring the skew premium via spot/vol covariance instead of a correlation provides a different picture: the realised parameters now trail the implied ones, damaging the long skew trades. The spot/vol correlation and vol and vol-of-vol premia all contribute towards a skew premium: the persistence of the vol-of-vol premium in FX (see Ravagli 2015) also has a structural impact on the skew. Similar conclusions on FX skew premia hold over time: the skew-harvesting theme is better understood via the estimate involving spot/vol covariance over correlation, given a larger premium and a higher correlation with the corresponding PnL.
First-order Vega sensitivities for smile parameters
Vega terms can be neglected for short maturities but otherwise must be included, even if their impact wanes when trades are held until expiry (see Daviaud et al 2022; Daviaud 2024). We can similarly introduce options’ Greeks to measure the sensitivity to changes in skew and vol-convexity implied parameters. Our previous reports introduced the notion of a vol surface dynamics, whereby the ATM pillars are the independent variables driving the whole surface. A self-consistent smile model would specify how smile parameters change with implied vols. In practice, moves in smile parameters can be treated as independent from those in ATM vols if we compute the related PnLs accordingly. Here we pursue this ‘empirical’ approach, introducing two new Greeks , for the purpose:
such that
The fixed-delta risk-reversal (RR) and butterfly (Fly), related to the vols of strikes , and :
| RR | |||
| Fly |
are quoted directly in the FX market. With these caveats in mind, it appears sensible to test for the numerical validity of the following PnL expansion, which groups the first- and second-order sensitivities related to the same smile parameter with the breakeven terms from the previous section:
The expansion attributes the bulk of the long-term PnL to Theta and second-order Greeks, with the first-order-smile Greeks mostly being responsible for the PnL’s volatility. The functional forms for vol-of-vol and skew:
allow closed formulas for the smile first-order Greeks (see the next section).
The maturity sensitivity of the Volga and Greeks is tested empirically on the EUR/USD (straddle versus strangle) rate. The numerical analyses throughout this article rely on JP Morgan’s pricing. Consistent with analytical expressions, Volga rises in absolute value with the time to maturity, with exhibiting the same sensitivity to the maturity parameter. In addition, the two Greeks appear to be roughly proportional to each other, meaning that maturity and spot/smile effects are modest. These results are consistent with the expected scaling (with ):
given:
(see Ravagli 2015). Short-maturity constructs are more exposed to the vol-of-vol premium driver and wider at the front end of the curve, while long-maturity ones allow a repricing of the implied vol convexity to play a role.
The empirical analysis of the skew-related Greeks, however, shows a linear sensitivity of to the maturity, while Vanna shows tighter variations. Within the Black-Scholes environment, fixed-delta options converge to a non-zero Vanna in the limit of zero time to maturity. Analogously to the vol convexity above, the observed scaling is qualitatively consistent with the analytical expression:
For the skew-sensitive Greeks, Vanna dominates for short maturities and dominates for long maturities, as is the case for Gamma versus Vega. Hence, short-maturity options are best suited for taking a view on the skew premium, while longer-dated ones are more exposed to the changes in the implied parameters.
Taking smile parameters’ term structure into account
The PnL expansion above does not account for the structural inversion of the vol-of-vol curve (Ravagli 2022). First-principle arguments permit accounting for term-structure effects on the Greeks. Within the underlying formalism, where the ATM vol and the smile’s skew and convexity are the dynamic variables, the task involves expressing the sensitivities to the flies via the curvature parameter of the smile expansion and the implied vol-of-vol, which introduce an explicit maturity dependence. Empirical analysis consistent with first principles (see Bergomi & Guyon 2012) supports a scaling like:
where Fly is the butterfly with time to maturity , is the ATM vol of the same maturity and is a constant. Throughout this article, we have assumed the following equality, valid for zero skew, holds:
which leads to the estimate:
It then holds that:
and, based on the suggested scaling above:
which leads to:
This expression consists of two terms, one dependent on the changes of the butterfly and one on the time to maturity. The expression isolates the relevance of the second term over the first for short maturities, where the term-structure effect is stronger. The functional relation between and Volga leads to the following correction of the vol-of-vol premium formula due to term-structure effects:
The vol-of-vol curve makes the skew exposure maturity-sensitive even if the parameter does not exhibit a structural term structure. After finding a functional relationship between risk reversal and the spot/vol correlation, we can repeat the steps above and isolate the maturity-dependent term:
| RR | |||
We rely on:
We assume a scaling for the spot/vol correlation parameter, consistent with stochastic volatility models (for SABR, see Hagan et al (2002)) as:
The full formula accounting for changes in flies becomes:
which, considering the functional expression of , leads to an adjusted skew premium given by:
For both vol convexity and skew trades, the vol-of-vol term-structure corrections compress the expected PnL from the premiums’ terms (see the next sections). While they are still strike independent, these corrections are maturity-sensitive, breaking additivity at the portfolio level.
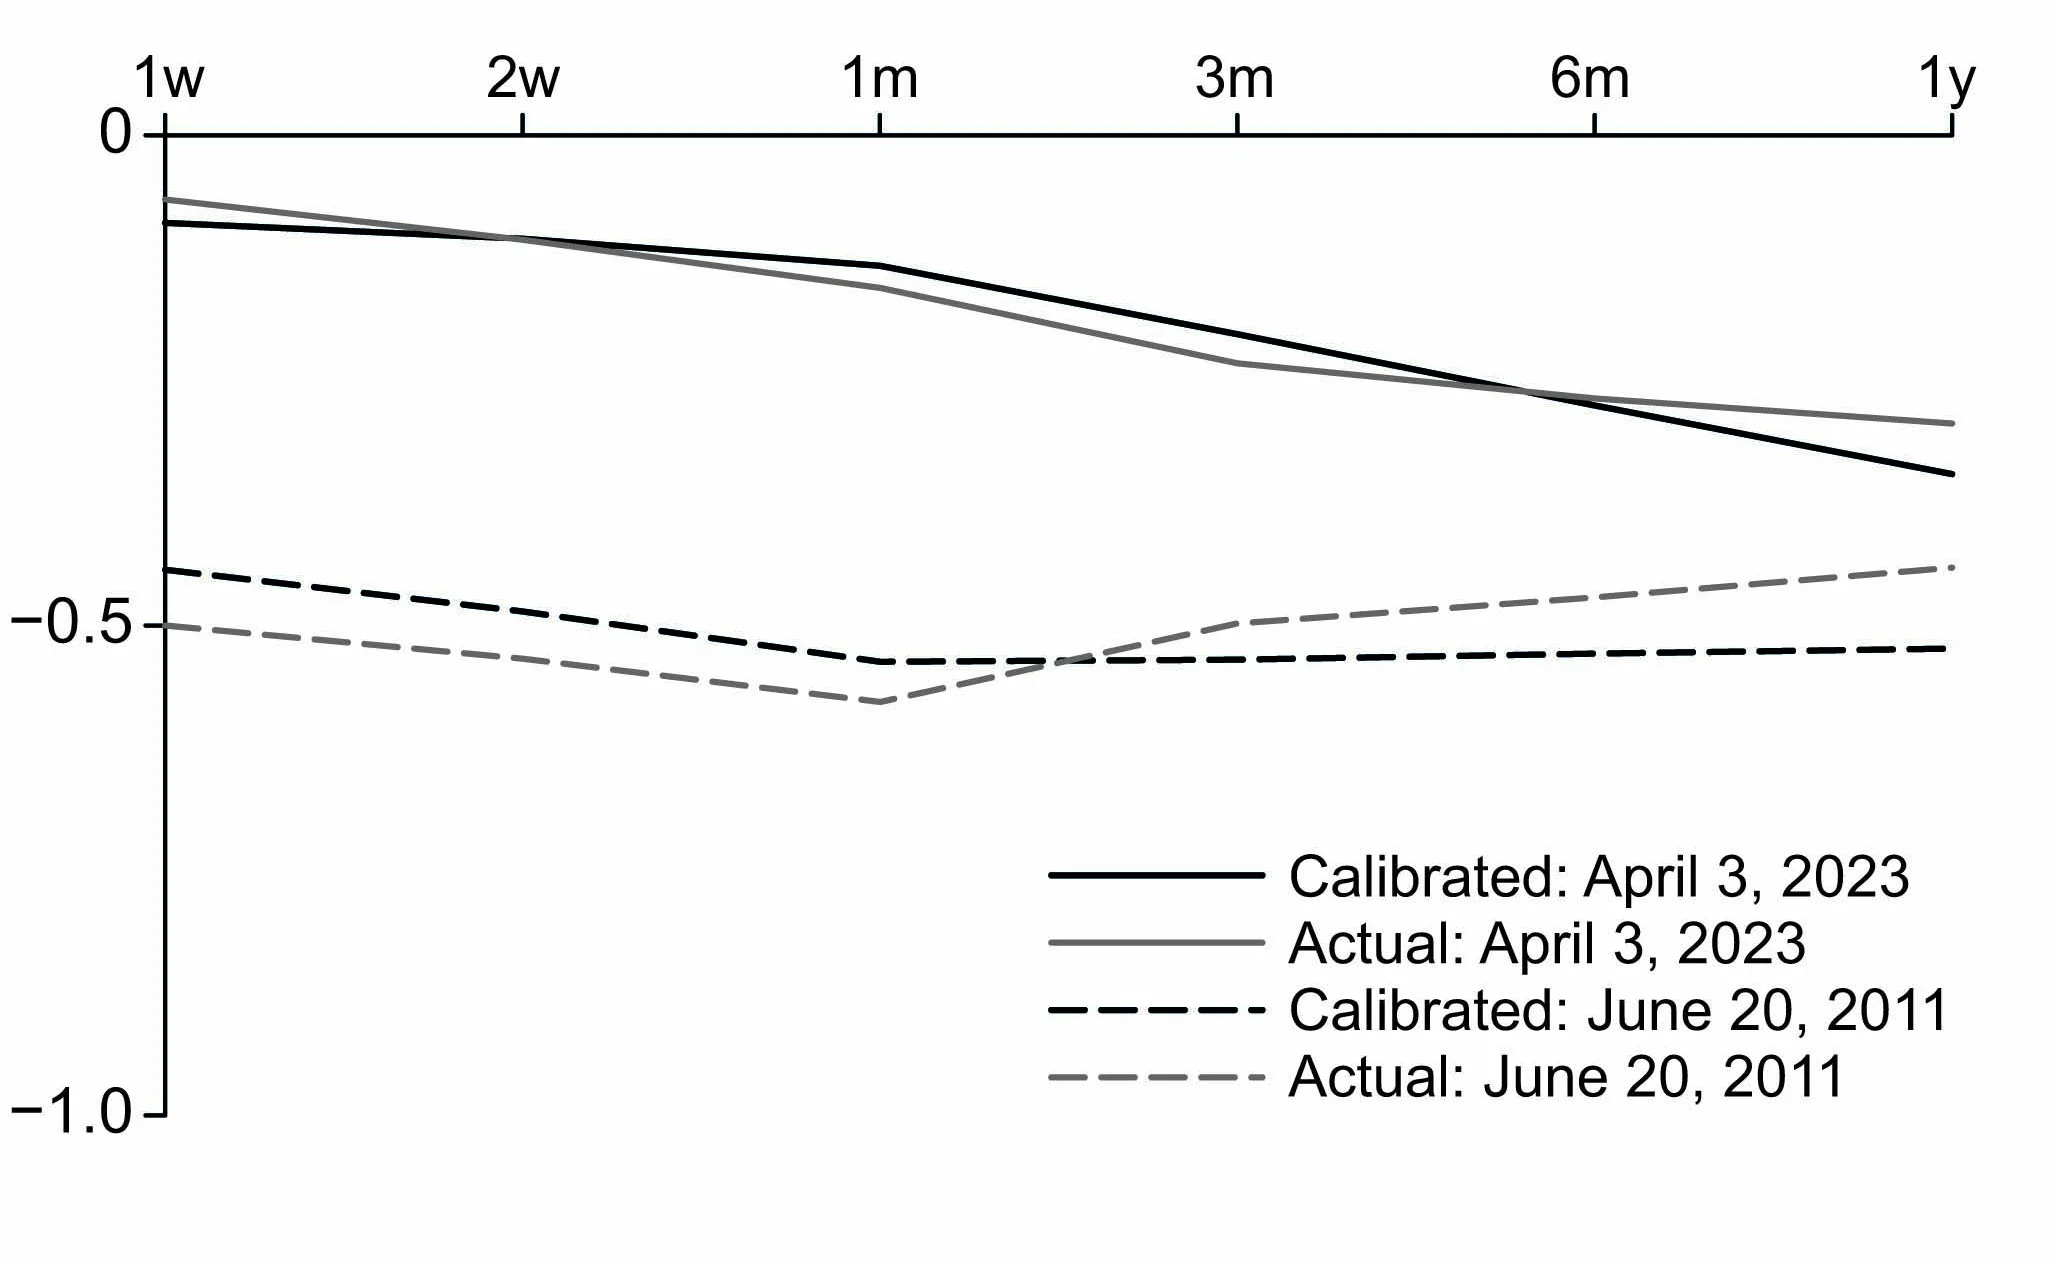
Case studies are supportive of the functional scaling for vol-of-vol and spot/vol correlation parameters considered above, with the choice of and . For the EUR/USD rate, the fits of both the implied vol-of-vol (Ravagli 2024) and spot/vol correlation (figure 2) curves for multiple dates find an acceptable, if not perfect, agreement. The goodness of fit of the interpolation is generally confirmed over time, with some variability, depending on the currency pair under examination.
As seen earlier, the and parameters may be inferred from the scaling of the first-order versus second-order Greeks. However, if expressed via the first-order smile Greeks, the term-structure corrections above are no longer directly sensitive to and . Numerical analyses will be performed via the first-order Greeks, allowing a more direct interpretation of the PnLs.
Vol convexity strategies: empirical analyses
This framework for detecting smile premia is first tested on vol convexity strategies, expanding on previous research (Ravagli 2015, 2022). The PnLs given in figure 3 are for a three-month (3M) straddle versus strangle trades, in equal Vegas, with data since January 2008. As the goal here is that of PnL attribution, the analyses below assume zero trading costs. The Greeks and PnLs are computed by cumulating positions daily, and hence the portfolios include options with different expiries.
Figure 3(a) shows the time series of the EUR/USD actual and Greek-based PnLs. The ‘four Greeks’ curve refers to the Volga, Gamma, Vega, Vanna; the ‘six Greeks’ curve adds and ; the ‘eight Greeks’ curve adds the two term-structure corrections. The Volga PnL curve exhibits a smooth upward slope and is the main contributor to the cumulative PnL of the strategy but, given the other Greeks’ spurious sensitivities, it is not the sole PnL driver during the life of the options (the -squared () for the daily PnL is quite low). As Vega and Gamma PnLs can be significant during the ‘life’ of the options (Vega-neutrality holds at inception), the ‘four Greeks’ description is much closer to the actual PnL of the strategy, with some contribution from Vanna for currencies where the skew is wide. First-order smile Greeks and term structure corrections tend to compensate for each other, confirming their non-trivial interplay, as seen earlier. For EUR/USD and across liquid USD/ and JPY/ crosses, the PnL description with six Greeks has higher coefficients than with four Greeks, with the new smile first-order Greeks adding value for PnL attribution purposes. Term-structure effects allow us to obtain a closer agreement for cumulative PnLs than for the ‘six Greeks’ case while achieving a higher than for the ‘four Greeks’ case.
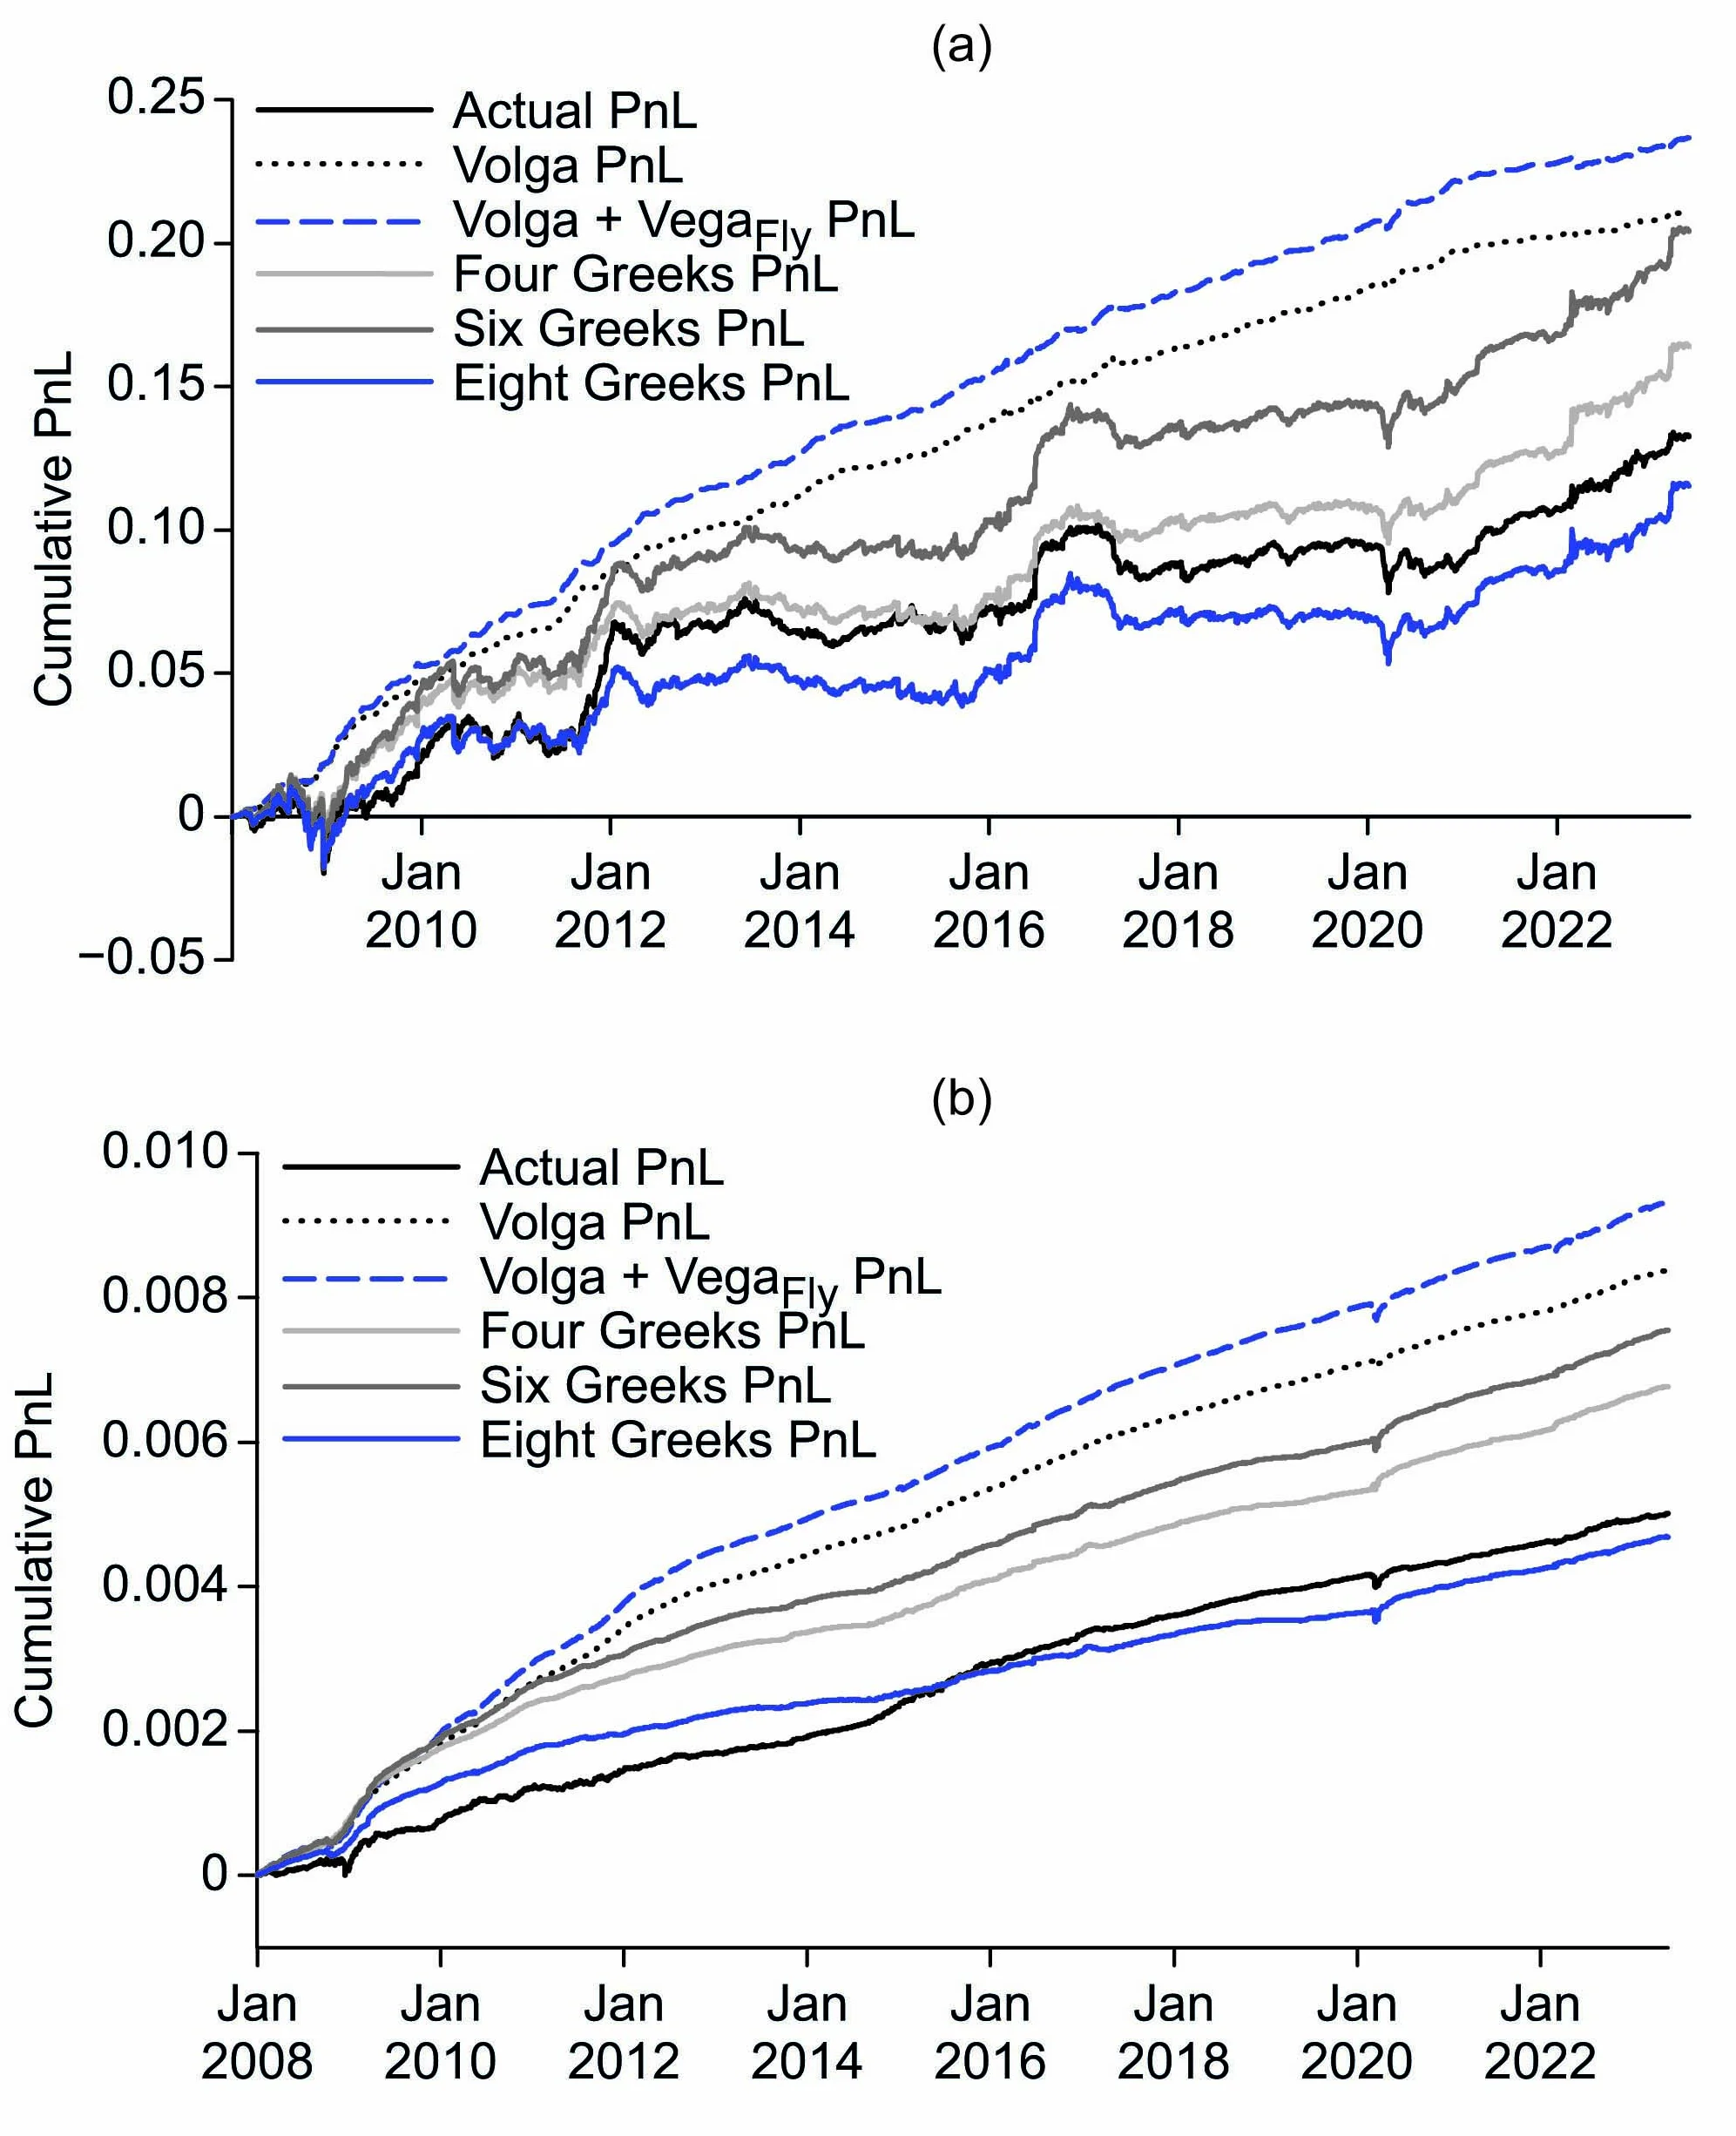
The picture is confirmed for one-day (1d) holding periods, where the impact of spurious Greeks is, by construction, contained. Again, the zero-cost limit is reviewed for the sole purpose of PnL attribution. For 1d holding periods (figure 3(b)), the agreement between actual and Volga PnL time series is indeed tighter, as the former also enjoys a smooth rise. This confirms the appeal of short-Volga trades in the first place as well as the need to control spurious effects for vol-of-vol harvesting purposes. While low (below 7%), the of the regression combining Volga and factors is well above the 1% (in line with Sepp (2010) for equities) associated with the sole Volga. As for the constructs held until expiry, considering four and six Greeks improves the PnL time series description incrementally. Finally, term structure corrections grant an even more similar description of the PnLs, especially regarding the drift of the time series (more than on the daily ), by reducing the expected premium associated only with the Volga term.
The new adjustments attributed to the inverted vol-of-vol curve grant a more similar description of the PnLs, balancing first-order smile sensitivities and confirming their interplay, as per the theoretical framework. As these effects are highly sensitive to the vol-of-vol scaling functional expression, there is room for the analysis to be fine-tuned, while generally validating this proxy description. Our results confirm the adequacy of the PnL interpretation for the vol-of-vol strategies covered in previous reports.
Skew strategies: empirical analyses
We tackle FX skew premium-harvesting strategies by systematically selling 3M JPY and USD calls and buying puts. The yen and US dollar are the two main currencies for which the sign of the skew is persistent over time, mirroring the case of equities. Positions are cumulated and delta-hedged daily and held until expiry, factoring in a realistic impact of trading costs. The same Delta (25%) and Vega are chosen for calls and puts at inception.
At a high-level, the backtests for JPY- and USD-crosses (figure 4(a)) indicate the feasibility of extracting the FX skew premium, at least for the most liquid G10 space,11 1 The group of major currencies that are actively traded among the Group of Ten (G10) countries. with all pairs displayed delivering a long-term positive PnL after costs. These results are consistent with previous observations of a skew premium in equities (Bergomi 2009; Hull et al 2012; Kozhan et al 2013) and FX (Broll 2016). Figure 4 covers risk-reversal trades, although a skew premium could be sourced from other vanilla and exotics constructs as well. The deep liquidity of risk reversals and the diversification that short-skew offers against short-vol and other systematic option strategies make a strong business case for the inclusion of FX short-skew structures within invested portfolios and for further innovation in this space.
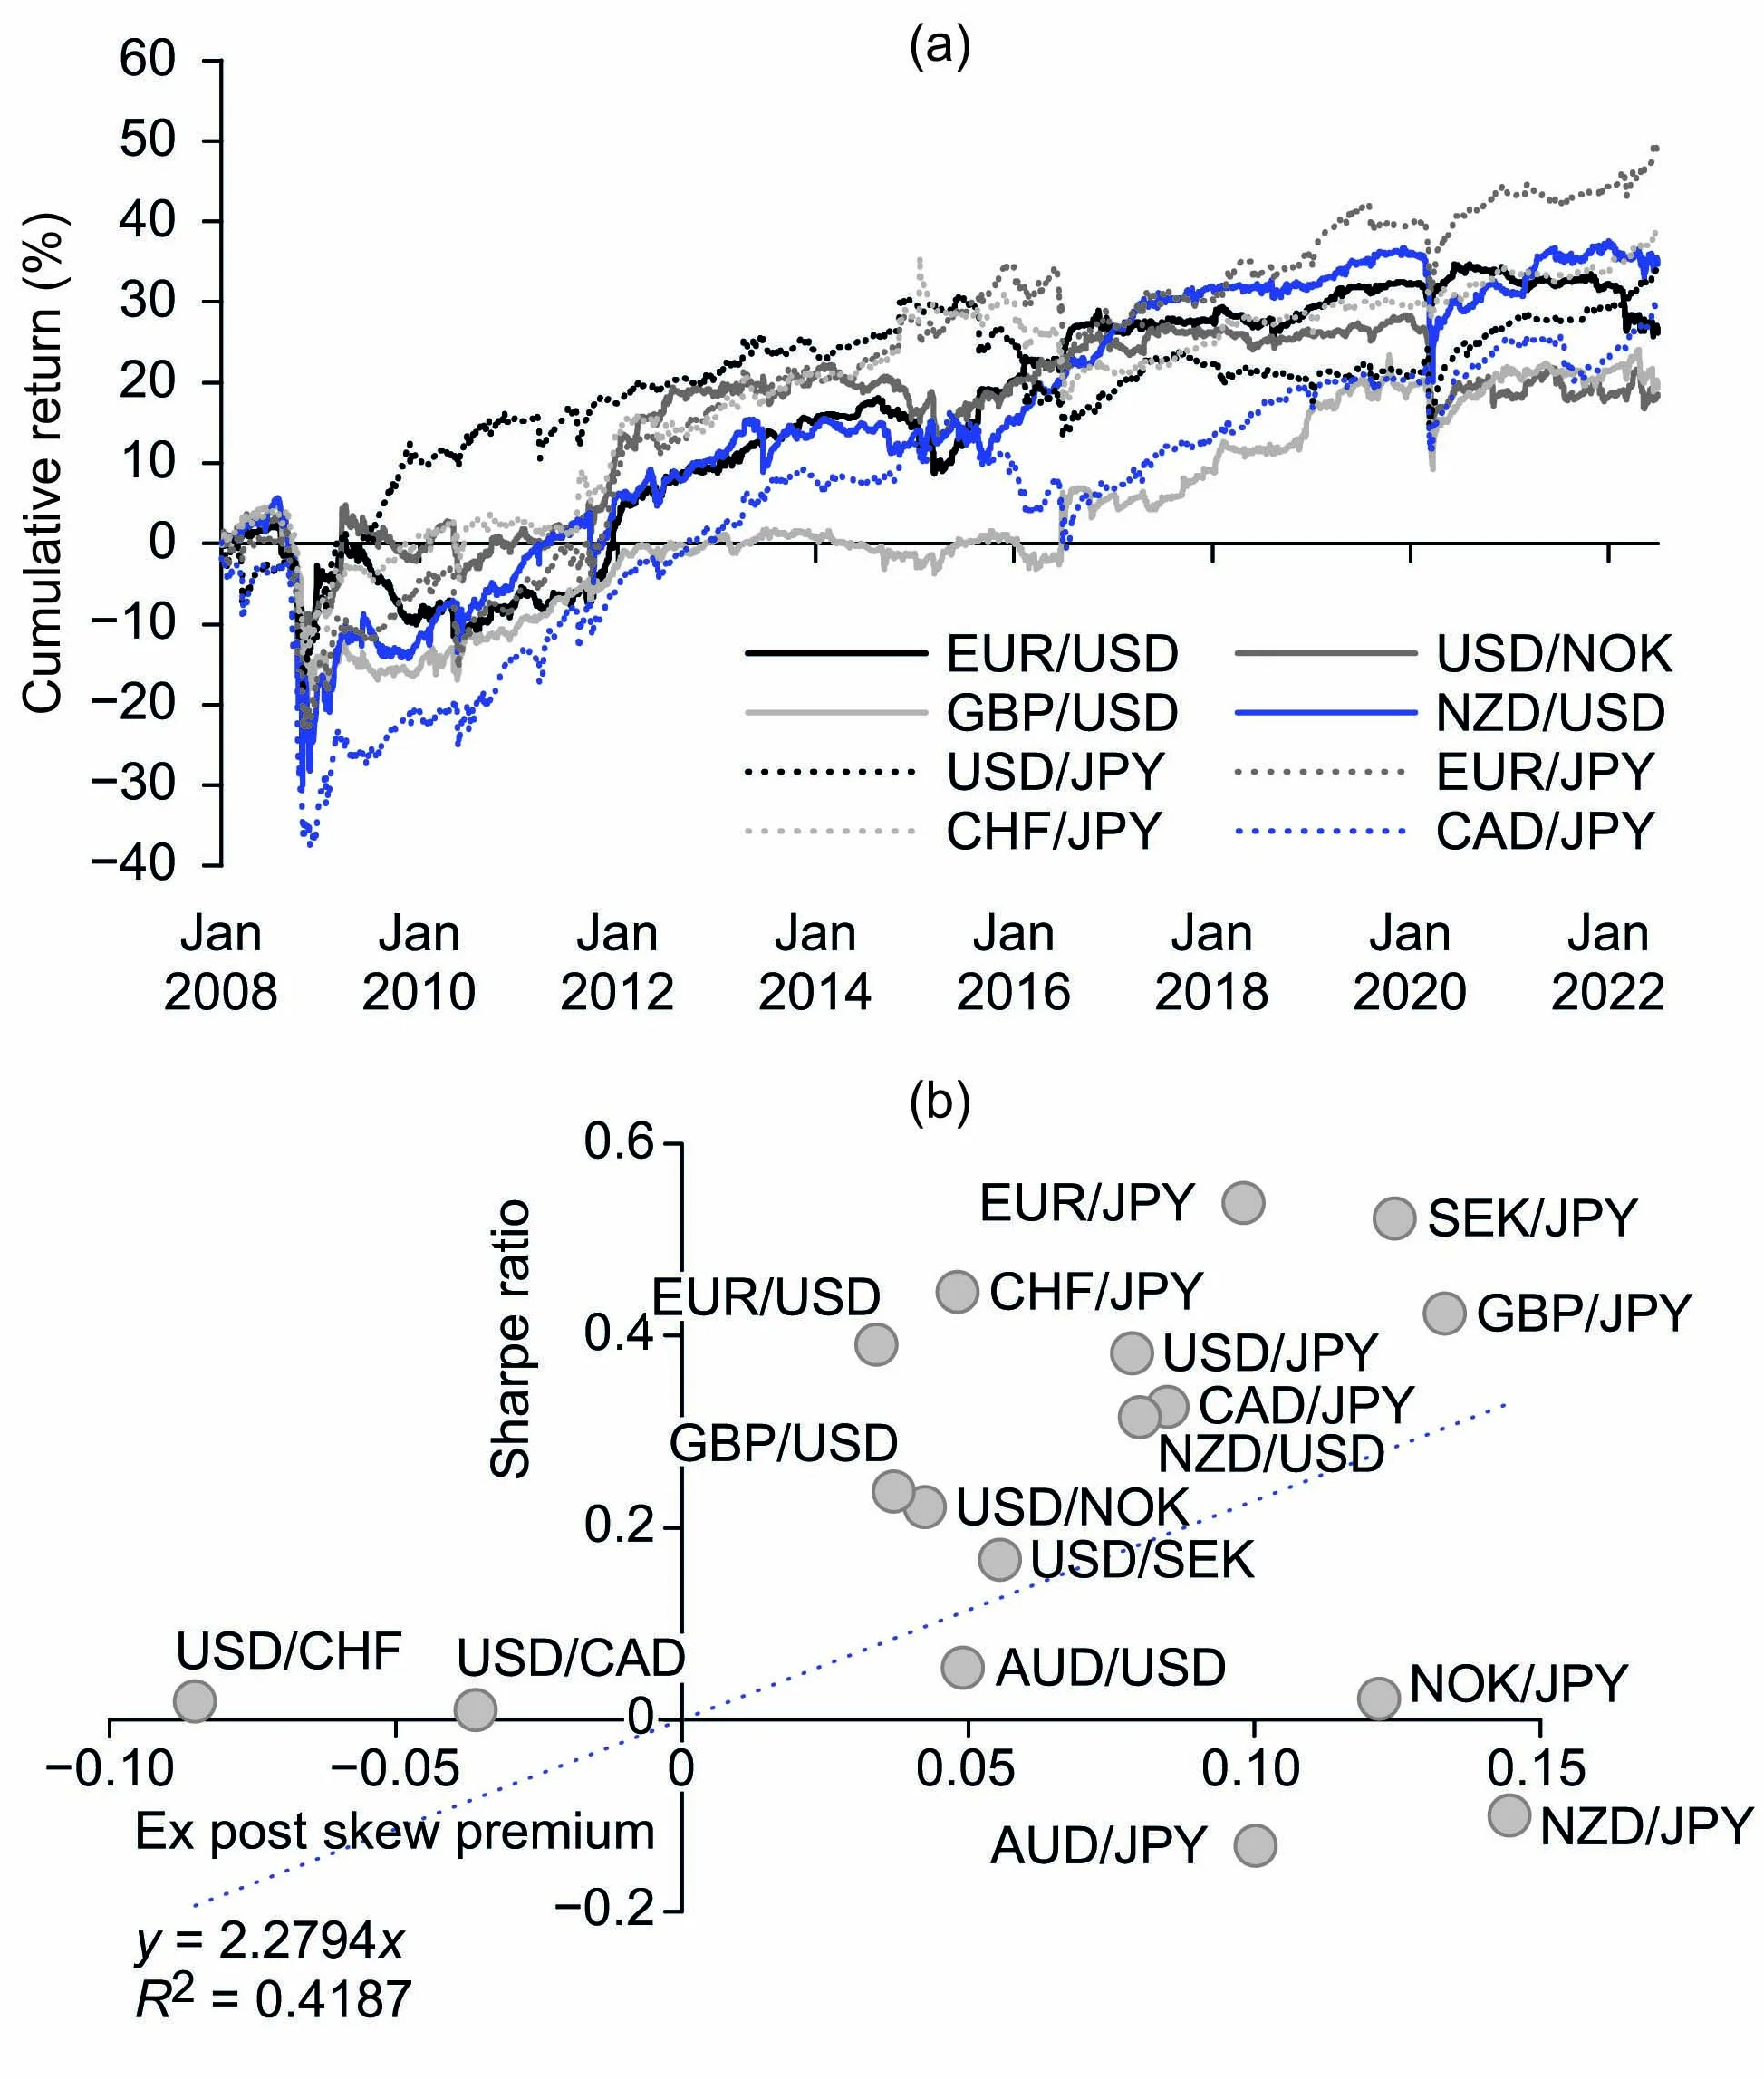
Figure 4(b) compares the Sharpe ratio of the strategy (-axis) with ex-post estimates of the skew premium (-axis), based on spot/vol covariances. The agreement between the skew premium estimate and corresponding PnL is good for the JPY-crosses. The AUD/JPY and NZD/JPY are the only two cases where the returns of the skew-harvesting strategy, selling JPY calls over puts, are negative. In all other cases the strategy’s positive PnL is matched by the sign of the skew premium. The results for USD/G10 pairs are qualitatively aligned: the PnL and skew premium all have the same sign beyond USD/CHF. The skew premium supports selling US dollar calls in all cases except USD/JPY, where it favours selling JPY calls instead. The scatter plot confirms the solid, positive correlation between skew premium and PnL. For the pairs tested, the proxy of the skew premium that includes vol and vol-of-vol corrections is better aligned with actual PnLs than with the naive analysis based only on spot/vol correlations (see figure 1, where spot/vol correlations and covariances trigger opposite signals for buying or selling the skew).
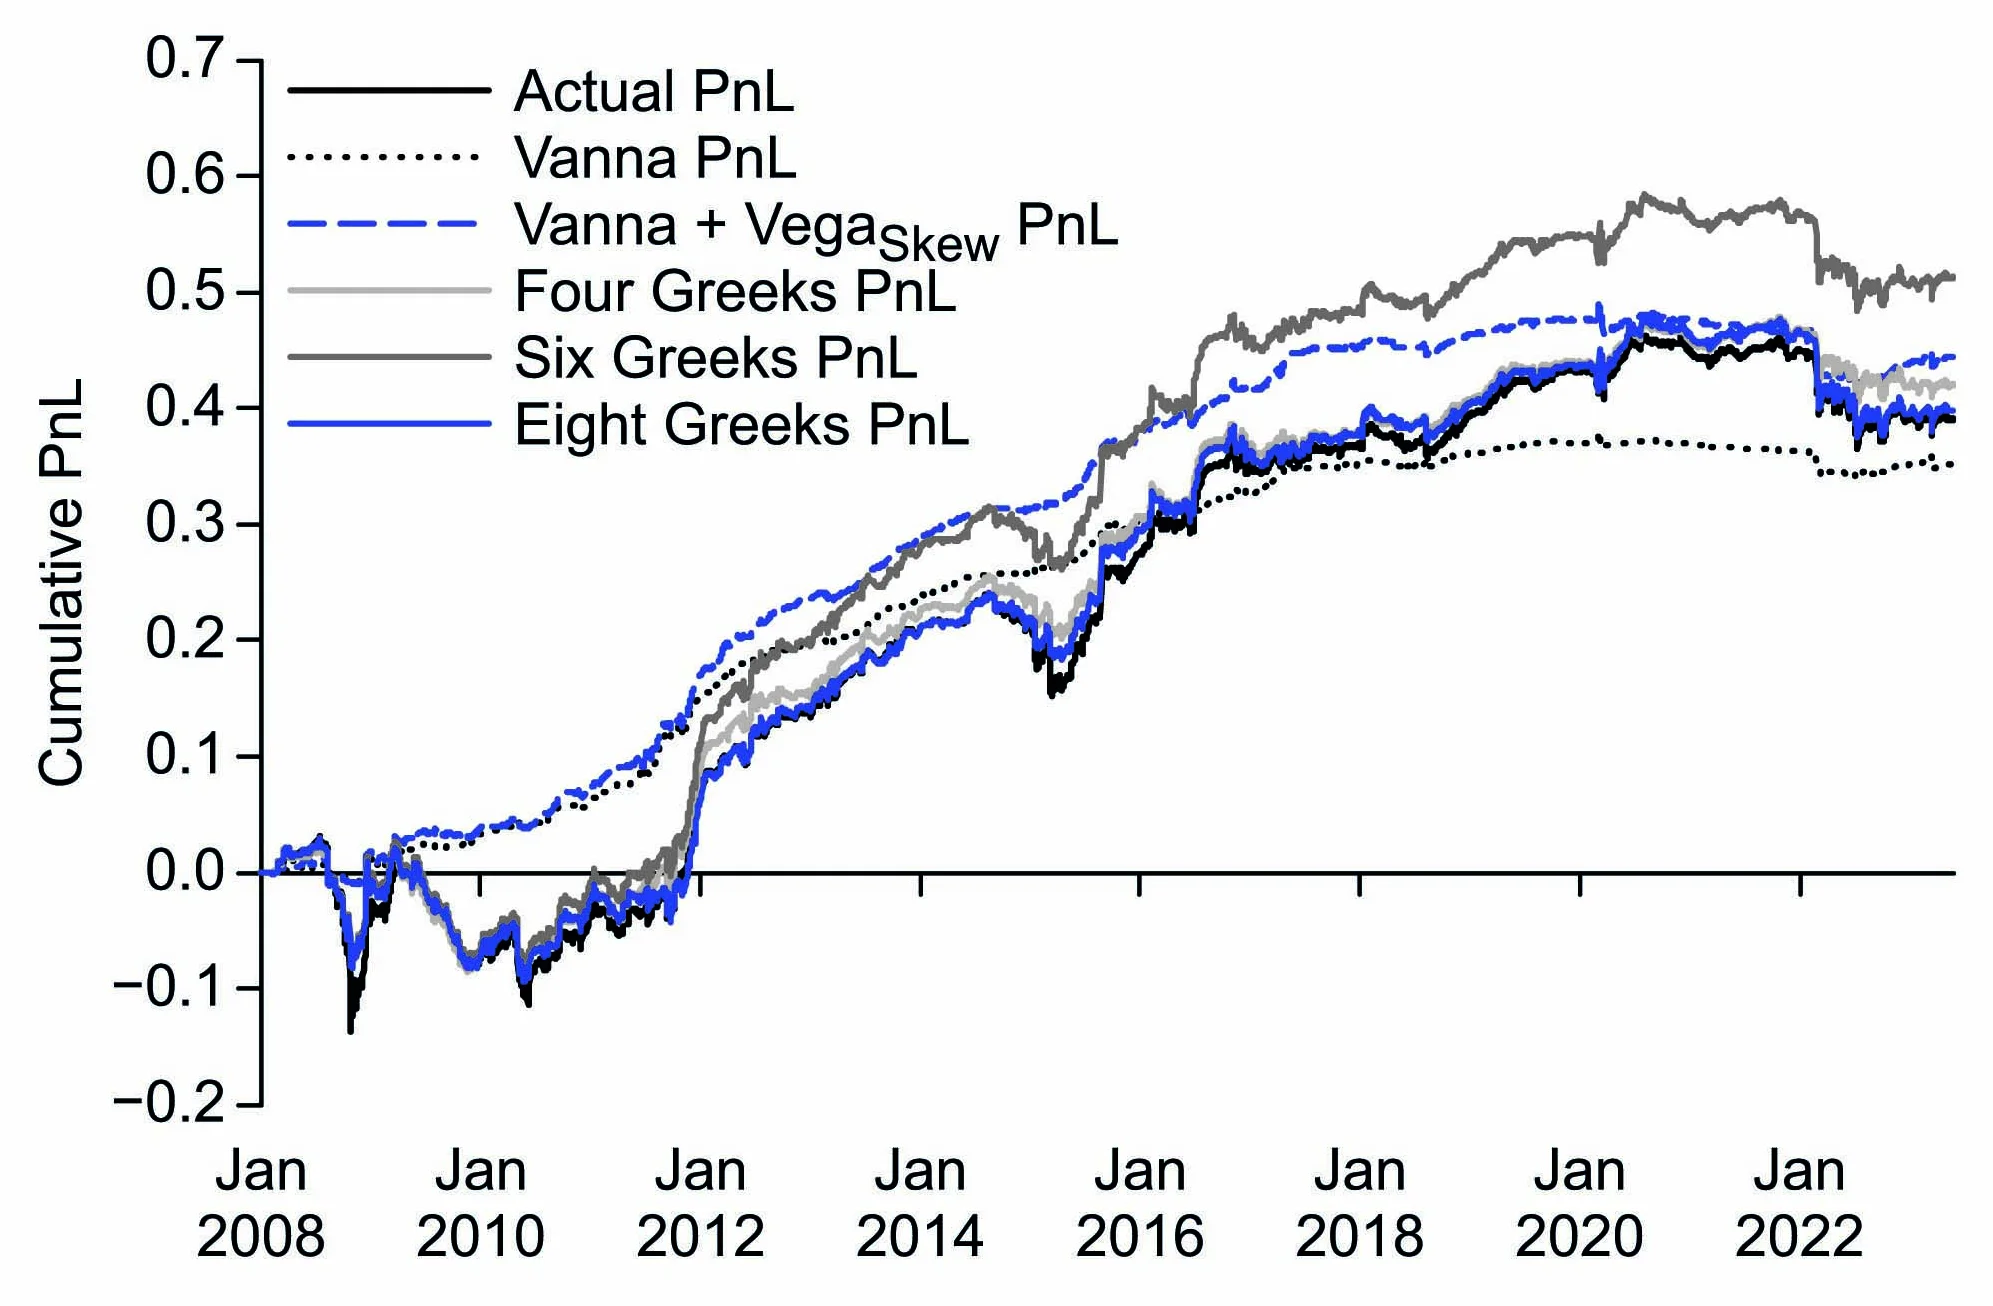
We now review the drivers of risk-reversals trades. For EUR/USD, the of the sole Vanna Greek is low (13%) but it improves by combining the two skew-sensitive Greeks, Vanna and (23%). The use of the four Greeks as in the previous section leads to a solid description (83% ), with just Gamma and Vega associated with an of 73%; during the life of the trades (here held until expiry) the impact of these ‘spurious’ Greeks would become dominant over Vanna. Adding the remaining four Greeks (Ravagli 2024) provides an additional 4% in . We stress that these are all one-dimensional regressions, so that the higher s are not attributable to an increase in the degrees of freedom. While the fluctuations of the daily PnL are largely influenced by the Gamma and Vega sensitivities, the cumulative PnL (figure 5) is mostly driven by the positive trend resulting from the Vanna, as was the case for vol-convexity trades. The description of cumulative PnL with eight Greeks is excellent, with the term-structure term balancing the effect of the first-order smile Greek, which was pushing the drift further away from the actual PnL, against that of the ‘four Greeks’ case.
These findings are consistent across different currency pairs. Our interpretation of the skew premium attributable to the Vanna and our interpretation of the PnL drivers of skew-exposed strategies, particularly regarding second- versus first-order risk sensitivities, are well supported by the actual data. Skew-harvesting trades accumulate a steady, positive PnL via the Vanna term, but they are sensitive to spurious exposures such as Gamma and Vega. The new term helps to interpret the PnLs, particularly when the implied skew undergoes large swings (as, for instance, for USD/JPY from September 2022 to March 2023, with the skew flipping from positive values to negative values). Unlike the Vanna-axis, is mostly more responsible for the PnL’s volatility than drift. Term structure corrections provide an excellent description of PnLs, as far as the and drifts (ie, agreement with cumulative PnLs) are concerned.
| Vol convexity | Skew | |||||||
| # of | EUR/ | EUR/ | AUD/ | EUR/ | EUR/ | AUD/ | ||
| Greeks | Greeks | USD | JPY | JPY | USD | JPY | JPY | |
| 1 | Volga | 0 | 1% | 0 | Vanna | 13% | 16% | 17% |
| 2 | Volga | 0 | 1% | 0 | Vanna | 23% | 26% | 19% |
| +Vega_Fly | +Vega_Skew | |||||||
| 4 | Gamma, Vega, | 61% | 77% | 83% | Gamma, Vega, | 83% | 92% | 95% |
| Vanna, Volga | Vanna, Volga | |||||||
| 6 | 4+Vega_Fly | 65% | 82% | 86% | 4+Vega_Fly | 87% | 96% | 98% |
| +Vega_Skew | +Vega_Skew | |||||||
| 8 | 6+Fly_TS | 65% | 82% | 86% | 6+Fly_TS | 86% | 96% | 98% |
| +Skew_TS | +Skew_TS | |||||||
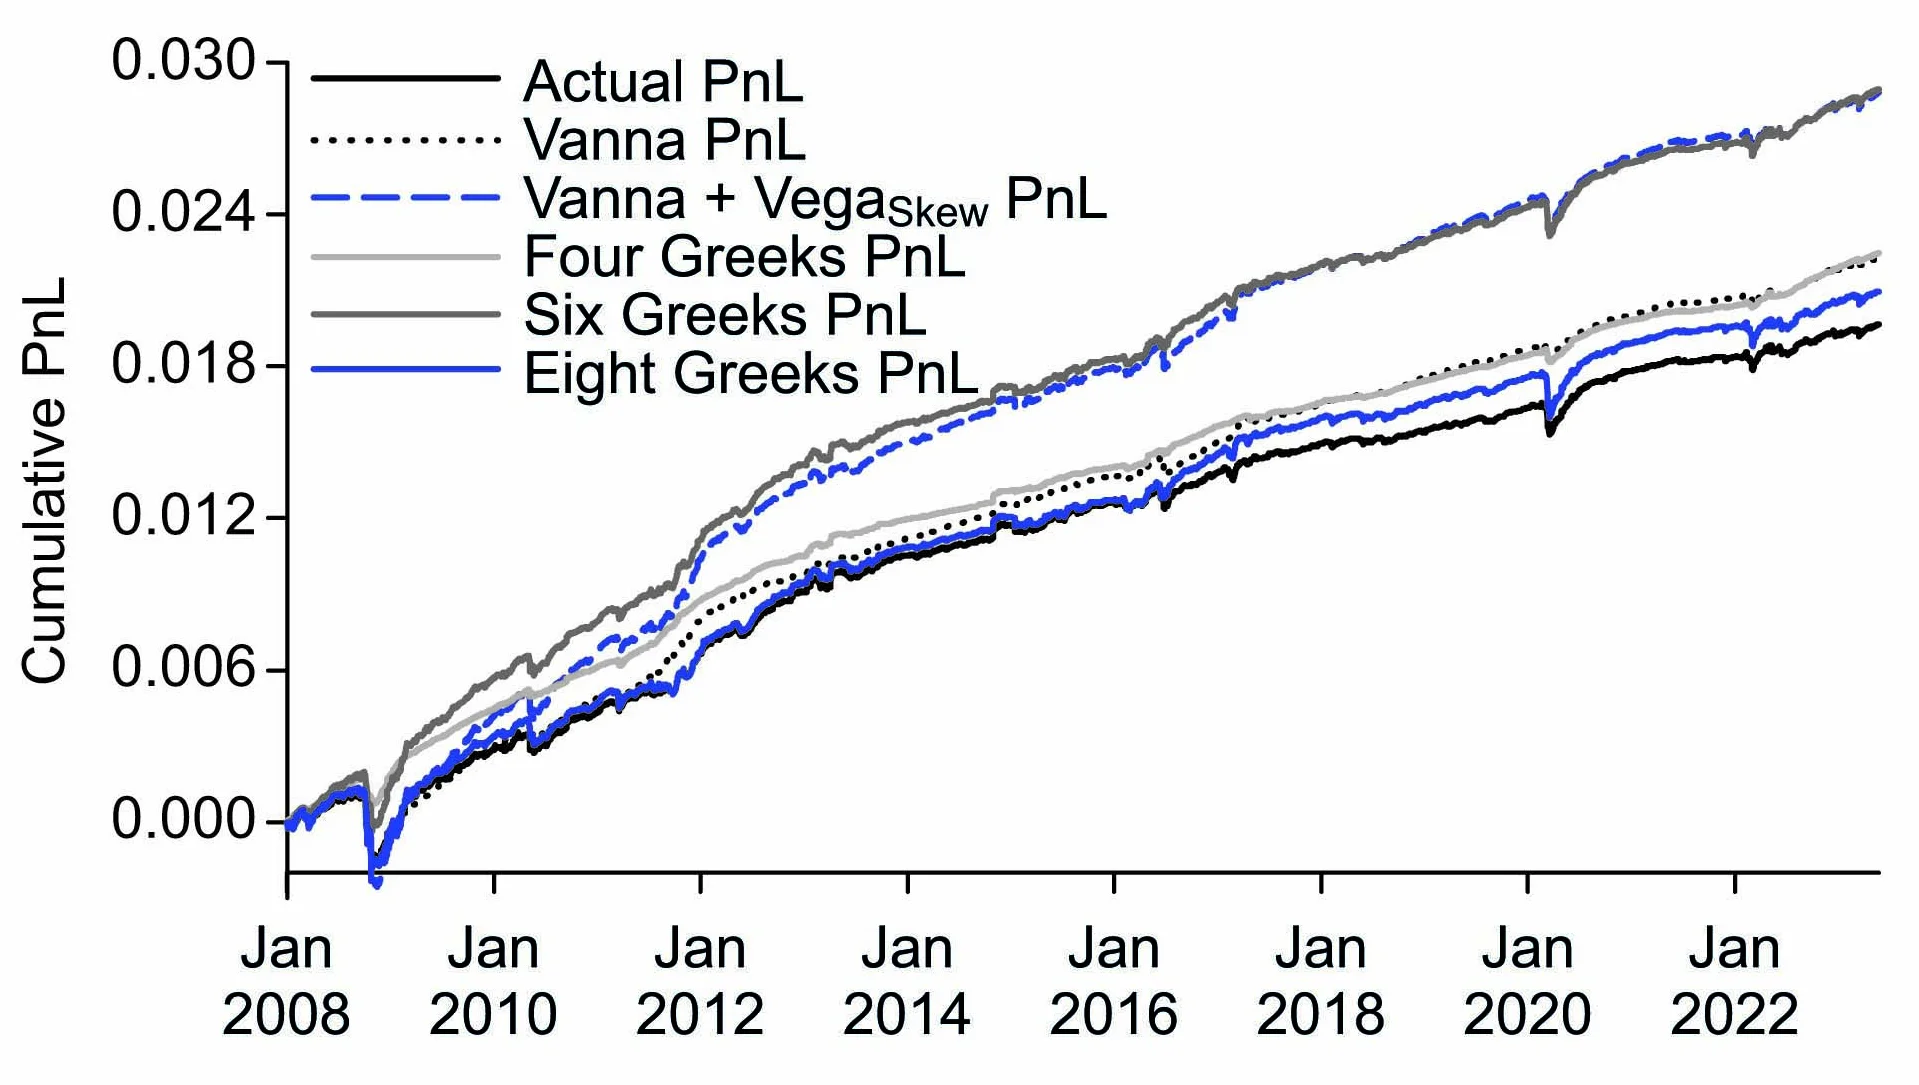
Table A reviews the explanatory power () of the regressions where the number of Greeks is increased, for different pairs. For both vol-convexity and skew strategies, the added value of the first-order smile Greeks is more significant than the description with four Greeks. The inclusion of the term-structure effects does not improve further but allows a better description of cumulative PnLs relative to the ‘six Greeks’ case. These results confirm the added value of the new Greeks introduced in this article.
The 1d holding period analysis sheds light on the genuine PnL drivers, minus spurious effects. For both EUR/USD (not displayed) and EUR/JPY (figure 6), the PnL description with Vanna and Greeks (an of 45% versus 92% and 44% versus 87%, respectively) tracks closely the actual daily PnL over time (as a comparison, Sepp (2010) quotes an of around 33%, tested on equities), validating the accuracy of the skew premium estimation and the added value of the new term. As noticed earlier, the inclusion of term-structure effects allows an excellent description of the PnLs for 1d holding periods, by offering a closer agreement of cumulative PnLs and improving s even further (the with eight Greeks is 95% for EUR/USD and 88% for EUR/JPY). Term-structure effects due to the inverted vol-of-vol curve tend to reduce the expected premium from the sole Vanna term, as is the case for vol convexity strategies (see figure 3(b)). The solid agreement with data supports the proxy scaling for the smile parameters that allowed a compact expression for the term-structure corrections.
Approaches such as stochastic and local volatility models, functional interpolation and the Vanna/Volga method (for a review, see Reiswich & Wystup (2010)) are all consistent with the formation of volatility smiles. The empirical analyses carried out in this article show the additional importance of monitoring smile parameters’ term-structure effects for PnL interpretation purposes.
Conclusion
The article sheds light on the feasibility of extracting a skew premium in the FX market, a feature which can bring diversification benefits to multi-asset portfolios. It discusses how the vol-of-vol parameter is the key contributor towards the skew premium, which involves the interplay of implied and realised spot/vol covariances. The note brings further elements of theoretical innovation via the introduction of new Greek letters that account for changes of the implied smile parameters and for term-structure effects.
Lorenzo Ravagli is the head of European FX vol strategy at JPMorgan Chase & Co in London. This work was undertaken as part of his mandate at JP Morgan. He thanks his colleagues Dobromir Tzotchev, Thomas Salopek, Marko Kolanovic, Juan Duran-Vara and Mark Rubery for useful discussions.
Email: lorenzo.ravagli@jpmorgan.com.
References
- Bergomi L, 2008
Smile dynamics IV
Risk January, http://www.risk.net/1564129 - Bergomi L and J Guyon, 2012
Stochastic volatility’s orderly smiles
Risk May, http://www.risk.net/2171452 - Broll M, 2016
The skewness risk premium in currency markets
Economic Modelling 58, pages 494–511 - Daviaud O, 2024
Rethinking P&L attribution for options
Risk May, http://www.risk.net/7959307 - Daviaud O and A Mukhopadhay, 2022
Linking option performance to the volatility premium
Risk July, http://www.risk.net/7951906 - Hagan P et al, 2002
Managing smile risk
Wilmott Magazine 1, pages 84–108 - Heston S, 1993
A closed-form solution for options with stochastic volatility with applications to bond and currency options
Review of Financial Studies 6(2), pages 327–343 - Hull B and E Sinclair, 2022
The risk-reversal premium
Journal of Investment Strategies 11(1), pages 59–75 - Jurek J, 2009
Crash-neutral currency carry trades
Working Paper, Princeton University - Kozhan R., A Neuberger and P Schneider, 2013
The skew risk premium in the equity index market
Review of Financial Studies 26(9), pages 2,174–2,203 - Ravagli L, 2015
Isolating a risk premium on the volatility of volatility
Risk December, http://www.risk.net/2437085 - Ravagli L, 2022
Trading the vol-of-vol risk premium
Risk December, http://www.risk.net/7955553 - Ravagli L, 2024
Harvesting the FX skew premium
Preprint, SSRN 4687408 - Reiswich D and U Wystup, 2010
FX volatility smile construction
CPQF Working Paper Series No. 20, Frankfurt School of Finance & Management - Schneider P and F Trojani, 2015
Fear trading
Working Paper 15-03, Swiss Finance Institute Research - Sepp A, 2010
Profit-and-loss of options strategies under quadratic skew parameterisation
Preprint, SSRN 1697829
Only users who have a paid subscription or are part of a corporate subscription are able to print or copy content.
To access these options, along with all other subscription benefits, please contact info@risk.net or view our subscription options here: http://subscriptions.risk.net/subscribe
You are currently unable to print this content. Please contact info@risk.net to find out more.
You are currently unable to copy this content. Please contact info@risk.net to find out more.
Copyright Infopro Digital Limited. All rights reserved.
As outlined in our terms and conditions, https://www.infopro-digital.com/terms-and-conditions/subscriptions/ (point 2.4), printing is limited to a single copy.
If you would like to purchase additional rights please email info@risk.net
Copyright Infopro Digital Limited. All rights reserved.
You may share this content using our article tools. As outlined in our terms and conditions, https://www.infopro-digital.com/terms-and-conditions/subscriptions/ (clause 2.4), an Authorised User may only make one copy of the materials for their own personal use. You must also comply with the restrictions in clause 2.5.
If you would like to purchase additional rights please email info@risk.net
More on Cutting Edge
Podcast: Pietro Rossi on credit ratings and volatility models
Stochastic approaches and calibration speed improve established models in credit and equity
Degree of Influence 2025: Derivatives pricing dominates; quants don’t follow the AI herd
Rates and volatility modelling, as well as trade execution, top quants’ priorities
Neural networks unleashed: joint SPX/VIX calibration has never been faster
SPX and VIX options can be jointly calibrated in real time with deep neural networks
Bridging credit transitions and spread dynamics
A fast-to-calibrate model to simulate a credit rating transition matrix is presented
Floating exercise boundaries for American options in time-inhomogeneous models
A pricing model is extended to account for negative interest rates or convenience yields
Quantcast Master’s Series: Walter Farkas, ETH – University of Zurich
Swiss planning, large joint faculty and public presentations shape the programme
The relative entropy of expectation and price
The replacement of risk-neutral pricing with entropic risk optimisation
Quantcast Master’s Series: Jack Jacquier, Imperial College London
A shift towards market micro-structure and ML has reshaped the programme


