Swaps data: SOFR volume and margin insights
Data shows recent leap in SOFR trades – and hints at growth in synthetic swaps
This year promises to be an interesting one in derivatives markets, and with January volumes now in, I wanted to look at what the data tells us about two in-flight, high-stakes projects – interest rate benchmark reform and non-cleared margin rules.
Let’s start with the Alternative Reference Rates Committee’s (ARRC) progress on introducing a smooth and orderly transition from US dollar Libor to its replacement, the secured overnight financing rate (SOFR), under its published transition plan. This expects that during 2019, increased activity in SOFR-linked futures and overnight interest rate swaps (OIS) will build price histories and help market participants develop a term structure for SOFR.
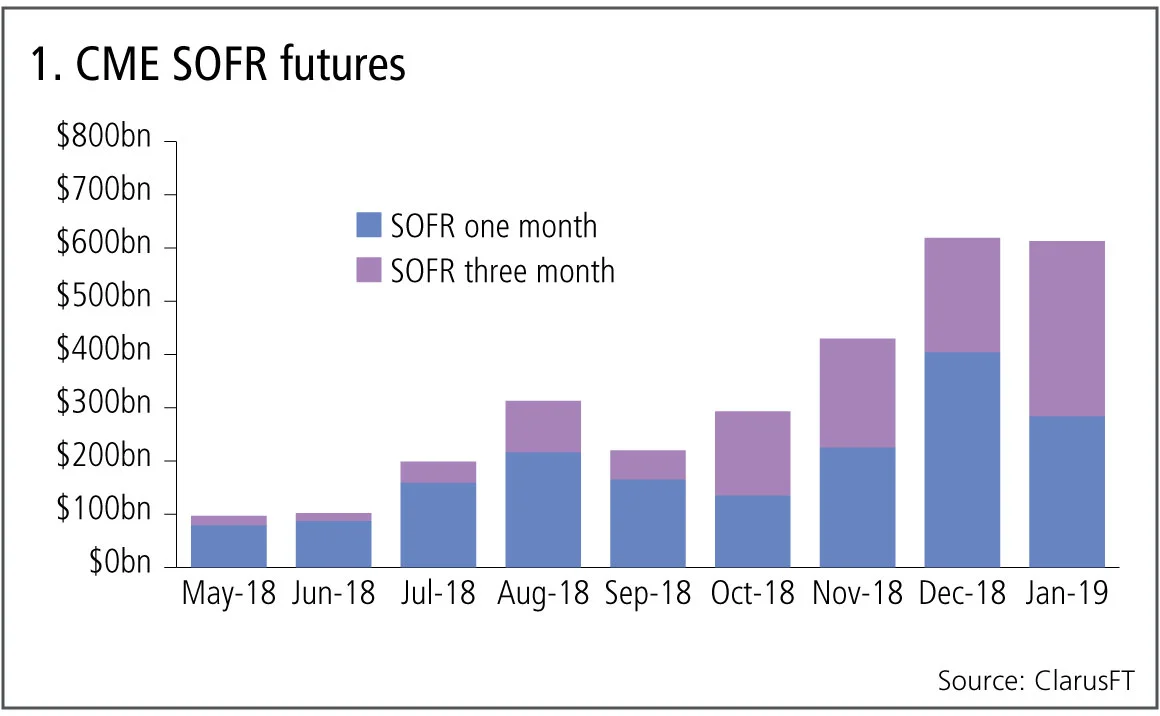
CME SOFR futures
SOFR futures were launched by CME in May 2018.

Figure 1 shows:
- Volumes continuing to rise month on month.
- $600 billion equivalent gross notional traded in each of the past two months.
- A cumulative total of $2.9 trillion in equivalent gross notional.
CME’s preferred measure, average daily volume (ADV) in number of contracts, shows January to be 18% higher than December, as the three-month contract has a lower equivalent notional than the one-month.
It will be interesting to see how volume develops in future months.
SOFR swaps
The first question for trading in SOFR swaps is which version of the product will dominate trading; will be it OIS versus fixed, similar to the well-traded Fed funds OIS, or will it be basis swaps, versus either Fed funds or Libor?

Figure 2 shows:
- OIS versus fixed swaps are clearly the most traded.
- Jan 2019 saw $6 billion gross notional, the highest month by far.
- All of the 25 trades in Jan 29 were traded off-swap execution facility (Sef) and the majority were cleared.
- Basis swaps – Fed funds versus SOFR – are the next largest product, with a cumulative gross notional of $1 billion since October 2018.
- There has only been a single Libor versus SOFR trade in this period.
As well as volumes increasing, we also need to see lengthening maturities if a SOFR term structure is going to develop.

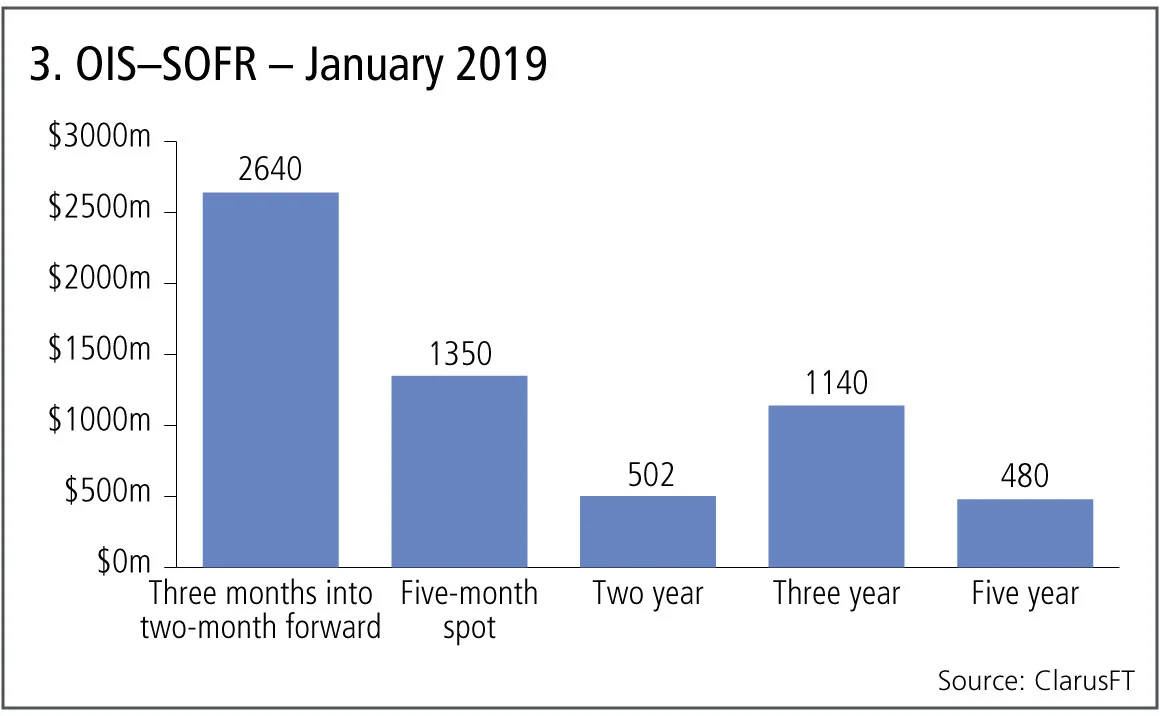
Figure 3 shows:
- January’s $6 billion of OIS SOFR swaps broken down by maturity.
- The first two bars, three months into two-month forwards and five-month spot starting, make up 65% of the volume.
- Two-year, three-year and five-year swaps make up the remaining 35%.
So, there is some evidence of longer maturities starting to trade.
We are still in the initial steps of the ARRC transition plan and as 2019 prices, volumes and maturities develop, a key next step will be in the first quarter of 2020, when clearing houses are expected to change their discounting curve to SOFR and pay SOFR interest on posted collateral – this will encourage market participants to use SOFR as the reference rate as well.
Non-cleared margin rules
Non-cleared margin rules currently require dozens of large dealers to collateralise their bilateral initial margin exposure, with hundreds more banks and end-users set to join them over the next 18 months as the final two phases of the rules are applied.
Option products are often the largest components of these bilateral exposures and generally linear delta risk is substantial in such portfolios. In addition, it is not straightforward to hedge this delta risk – for interest rate swaptions, the natural hedge would be a swap, but this has to be cleared and so cannot be booked into the non-cleared bilateral portfolio; for foreign exchange options, the natural hedge is forex forwards, which are not included in non-cleared margin rules.
Swaptions
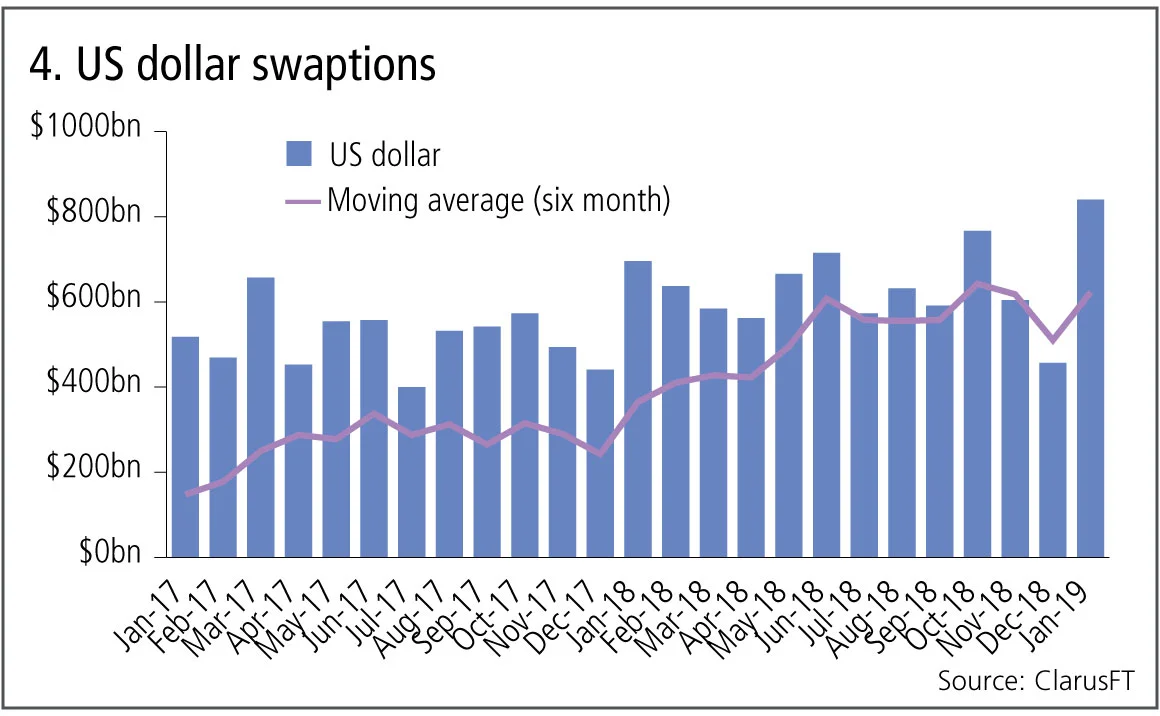
Let’s look at the volume of US dollar swaptions traded in the US to see if there has been any impact on this market from the potential increase in costs.

Figure 4 shows:
- Monthly volumes from Jan 2017 to Jan 2019.
- A six-month moving average line, rising from $460 billion a month at the start to $650 billion at the end.
- Definitely no adverse impact on volumes there, quite the opposite.
While some of the volume increase might be down to higher rates volatility in 2018 – resulting in more appetite for swaptions trading – a close look at the data reveals something else. Drilling down into January 2019 volumes (a record month), we see that 17% of the trades are equal and opposite swaptions – same strike, same expiry and underlying, meaning they only have linear delta risk and so behave like synthetic swaps. This activity was covered by Risk.net.
Non-deliverable forwards
Next the volume of uncleared non-deliverable forwards in major currency pairs – Australian dollar, euro, sterling and yen.

Figure 5 shows:
- A surprising and significant increase in monthly volumes.
- Volumes rise from $40 billion in January 2017 to $150 billion in January 2019.
- A pronounced rising moving average.
This is definitely not an effect we can put down to market demand as liquidity in these currency pairs is massively in the deliverable forex forward market.
The only explanation for these is the requirement to delta-hedge forex options in bilateral portfolios under non-cleared margin rules, as non-deliverable forwards count as a derivative product that is in scope.
Interesting that in this case non-cleared margin rules have resulted in more volume in a non-cleared product, but the driver of reducing initial margin exposure and need for collateralisation is certainly a good one and consistent with the objectives of reducing systemic risk.
Amir Khwaja is chief executive of Clarus Financial Technology.
Only users who have a paid subscription or are part of a corporate subscription are able to print or copy content.
To access these options, along with all other subscription benefits, please contact info@risk.net or view our subscription options here: http://subscriptions.risk.net/subscribe
You are currently unable to print this content. Please contact info@risk.net to find out more.
You are currently unable to copy this content. Please contact info@risk.net to find out more.
Copyright Infopro Digital Limited. All rights reserved.
As outlined in our terms and conditions, https://www.infopro-digital.com/terms-and-conditions/subscriptions/ (point 2.4), printing is limited to a single copy.
If you would like to purchase additional rights please email info@risk.net
Copyright Infopro Digital Limited. All rights reserved.
You may share this content using our article tools. As outlined in our terms and conditions, https://www.infopro-digital.com/terms-and-conditions/subscriptions/ (clause 2.4), an Authorised User may only make one copy of the materials for their own personal use. You must also comply with the restrictions in clause 2.5.
If you would like to purchase additional rights please email info@risk.net
More on Comment
Beyond the hype, tokenisation can fix the pipework
Blockchain tech offers slicker and cheaper ops for illiquid assets, explains digital expert
Rethinking model validation for GenAI governance
A US model risk leader outlines how banks can recalibrate existing supervisory standards
Malkiel’s monkeys: a better benchmark for manager skill
A well-known experiment points to an alternative way to assess stock-picker performance, say iM Global Partner’s Luc Dumontier and Joan Serfaty
The state of IMA: great expectations meet reality
Latest trading book rules overhaul internal models approach, but most banks are opting out. Two risk experts explore why
How geopolitical risk turned into a systemic stress test
Conflict over resources is reshaping markets in a way that goes beyond occasional risk premia
Op risk data: FIS pays the price for Worldpay synergy slip-up
Also: Liberty Mutual rings up record age bias case; Nationwide’s fraud failings. Data by ORX News
What the Tokyo data cornucopia reveals about market impact
New research confirms universality of one of the most non-intuitive concepts in quant finance
Allocating financing costs: centralised vs decentralised treasury
Centralisation can boost efficiency when coupled with an effective pricing and attribution framework


