Market Panics: Correlation Dynamics, Dispersion and Tails
Lisa Borland
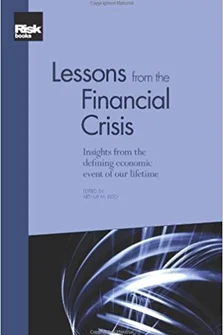
Introduction to 'Lessons from the Financial Crisis'
The Credit Crunch of 2007: What Went Wrong? Why? What Lessons Can be Learned?
Underwriting versus Economy: A New Approach to Decomposing Mortgage Losses
The Shadow Banking System and Hyman Minsky’s Economic Journey
The Collapse of the Icelandic Banking System
The Quant Crunch Experience and the Future of Quantitative Investing
No Margin for Error: The Impact of the Credit Crisis on Derivatives Markets
The Re-Emergence of Distressed Exchanges in Corporate Restructurings
Modelling Systemic and Sovereign Risks
Measuring and Managing Risk in Innovative Financial Instruments
Forecasting Extreme Risk of Equity Portfolios with Fundamental Factors
Limits of Implied Credit Correlation Metrics Before and During the Crisis
Another view on the pricing of MBSs, CMOs and CDOs of ABS
Pricing of Credit Derivatives with and without Counterparty and Collateral Adjustments
A Practical Guide to Monte Carlo CVA
The Endogenous Dynamics of Markets: Price Impact, Feedback Loops and Instabilities
Market Panics: Correlation Dynamics, Dispersion and Tails
Financial Complexity and Systemic Stability in Trading Markets
The Martingale Theory of Bubbles: Implications for the Valuation of Derivatives and Detecting Bubbles
Managing through a Crisis: Practical Insights and Lessons Learned for Quantitatively Managed Equity Portfolios
Active Risk Management: A Credit Investor’s Perspective
Investment Strategy Returns: Volatility, Asymmetry, Fat Tails and the Nature of Alpha
The financial crisis of 2008 prompted us to explore statistical signatures of market panic. In particular, we focus on the properties of the cross-sectional distribution of returns and propose a model for the cross-sectional dynamics. On daily timescales, we find a significant anti-correlation between dispersion and cross-sectional kurtosis such that dispersion is high but kurtosis is low in times of panic, and vice versa in normal times. This appears counter-intuitive at first, because times of panic have wild returns, so-called “black swans” (Taleb 2007) and rare events, which are typically associated with fat-tailed distributions (high kurtosis). We also find that the co-movement of stock returns increases in times of panic. In order to model these dynamics, we have proposed (Borland 2009) a joint stochastic process to describe the behaviour of stocks across time as well as their interactions at each point in time. The basic idea is a simple model of self-organisation, such that there occurs a spontaneous phase transition to a highly correlated state at the onset of panic. We quantify this with a simple statistic, s, the normalised sum of signs of returns on a given day, which
Copyright Infopro Digital Limited. All rights reserved.
As outlined in our terms and conditions, https://www.infopro-digital.com/terms-and-conditions/subscriptions/ (point 2.4), printing is limited to a single copy.
If you would like to purchase additional rights please email info@risk.net
Copyright Infopro Digital Limited. All rights reserved.
You may share this content using our article tools. As outlined in our terms and conditions, https://www.infopro-digital.com/terms-and-conditions/subscriptions/ (clause 2.4), an Authorised User may only make one copy of the materials for their own personal use. You must also comply with the restrictions in clause 2.5.
If you would like to purchase additional rights please email info@risk.net

