
This article was paid for by a contributing third party.More Information.
FX Options Skews: Economics and Implications

For example, out-of-the-money (OTM) put options on equity index futures are typically more expensive than OTM call options: investors typically fear a sudden fall in stock prices more than a sudden rise and, hence, are willing to pay more for downside than upside protection. In agricultural markets, skew tends to work the opposite way.
On corn, soy and wheat options, for example, OTM call options are usually more expensive than OTM puts. Food buyers fear a sudden spike in the price of these crops in the event of a bad harvest more than farmers fear a sudden price decline in the event of an exceptionally good harvest.
Currency options markets are quirkier than either equity or agricultural options markets.
Generally, traders fear a sudden drop in most currencies versus the U.S. dollar (USD) more than a sudden rise. Among the major currencies, the euro, pound and Australian and Canadian dollars tend to skew negatively versus USD, meaning that OTM put options tend to be more expensive than OTM calls.
The Japanese yen and Swiss franc tend to have the opposite skew. Yen and franc OTM call options are often more expensive than OTM puts. For all six currencies, the degree of skewness varies over time, driven to a large extent by two factors: interest rate differentials and political risks.
This paper also addresses another question: is option skewness (also referred to as “risk reversal”) a useful indicator of whether a currency will strengthen or weaken versus USD?
For example, if OTM put options become extremely expensive with respect to OTM call options, is that a sign that a given currency is likely to crash versus USD or that the currency might be oversold and is about to rebound? Our analysis doesn’t provide a definitive answer to these questions but might nevertheless offer some useful insights.
The Economics of Currency Options
The yen (JPY) and franc (CHF) are the two lowest interest rate currencies where OTM calls tend to be more expensive than OTM puts. Both Japan and Switzerland are famous for good food, great skiing and exceptionally low – sometimes even negative — interest rates. This means that the JPY and CHF are often used as funding currencies.
Investors often borrow funds in JPY or CHF and lend them elsewhere in the world where interest rates are higher, hoping to pocket the interest rate differential (or “carry”). Doing so can be profitable so long as the value of the accumulated carry exceeds any relative appreciation in the value of these two currencies. However, as investors learned in the fall of 1998 and several times after, the downside can be enormous when there is a sudden liquidation of carry trades that sends the value of these funding currencies soaring.
As such, OTM call options on JPY and CHF, which provide downside protection to anyone engaged in such a trade, tend to be more expensive than OTM puts.
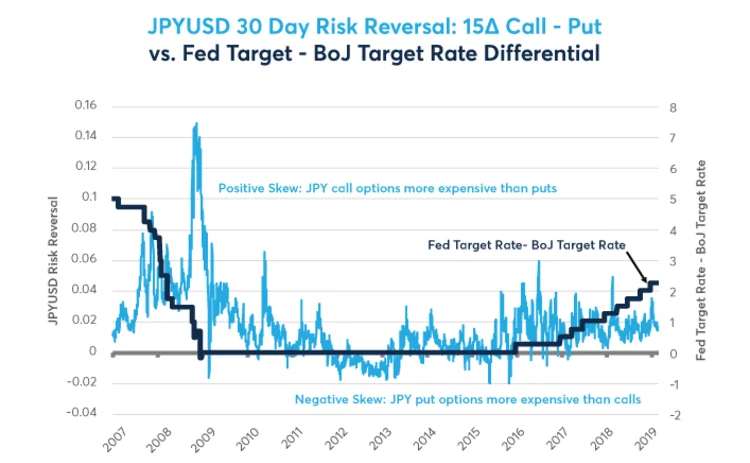
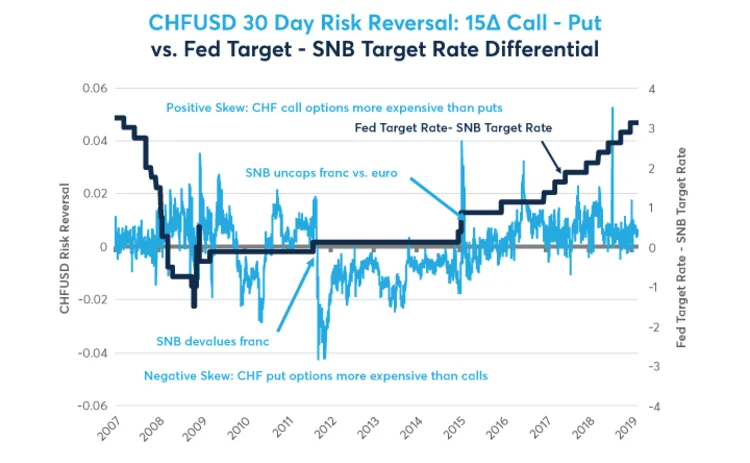
The degree to which OTM call options on JPY or CHF are expensive or cheap versus OTM puts is closely related to the interest rate gap between these currencies and the U.S. dollar (Figures 1 and 2).
When U.S. rates are much higher than Japanese rates, as they were before 2009, JPY OTM calls tend to be much more expensive than JPY OTM puts. Between 2009 and 2015, when U.S. rates hit zero and were close to those in Japan, the skewness mostly went away.
Since December 2015, when the Federal Reserve (Fed) began tightening, the yen’s positive skewness has made a reappearance. Indeed, during last fall’s equity selloff, the yen surged versus the USD, perhaps surprising some investors – but probably not those old enough to remember the yen’s 15% two-day spike versus USD in October 1998.
The franc follows a similar pattern. It ceased to be a funding currency from 2009 to 2015 and was, for a time, even negatively skewed versus USD.
Since 2015, however, as the Swiss National Bank (SNB) put rates deeper into negative territory as the Fed actively tightened policy, its positive skewness has reemerged. Memories of the SNB’s sudden CHF devaluation in 2011, however, might be putting a lid on the value of CHF OTM calls.
Even after years of negative rates and quantitative easing (QE), Swiss inflation is barely above half a percent and Switzerland’s highly open economy can scarcely afford the CHF to soar in a flight-to-quality panic like in 2010 and 2011 before the SNB intervened.
As such, the SNB might clamp down on any sudden rise in the value of the currency – or at least that’s the hope of anyone using CHF as a funding currency.
The Aussie (AUD) and Canadian (CAD) dollars nearly always skew the opposite way. Investors are almost always more concerned that they might suddenly fall versus USD than suddenly rise.
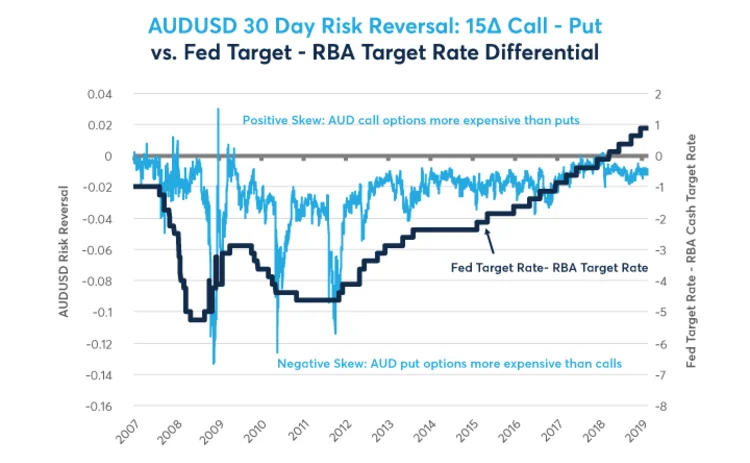
The degree of skewness, however, varies with the interest rate differential. From 2007 until 2012, U.S. short-term interest rates were much lower than their Australian equivalents and AUD put options were typically much more expensive than calls. After 2012, the interest rate gap narrowed and recently, for the first time in living memory, went the opposite way, with USD rates exceeding AUD rates.
Since the Fed’s tightening cycle got underway, the Reserve Bank of Australia has been easing policy and AUD options markets have shown only a small downside in skewness (Figure 3).
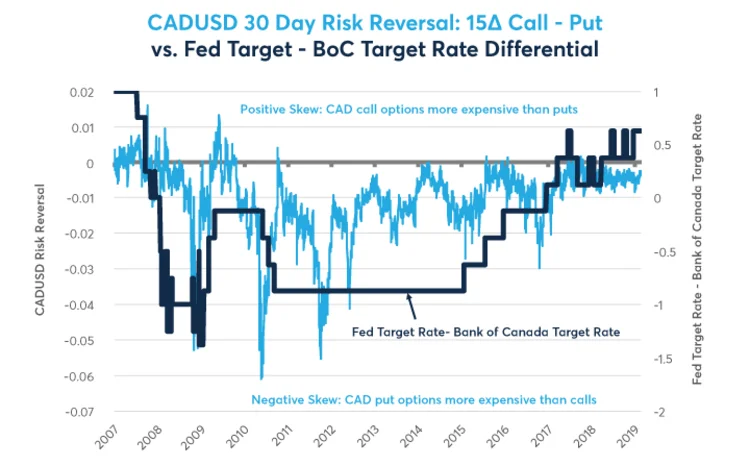
With Canada it’s a similar story, except that Canada had a smaller interest rate gap with the US before 2015 than did Australia, and CAD showed a milder downside skewness. Here, too, USD short-term rates now exceed those in Canada and the CAD’s downside skewness has mostly gone away (Figure 4).
With Australian and Canadian short-term interest rates now above those of the US, one might imagine that their OTM calls might become more expensive than their OTM puts, showing positive skewness.
This hasn’t happened yet.
The reason being that USD is still the global reserve currency and still tends to benefit from flight-to-quality events when investors flee risky assets. Often in such de-risking/flight-to-quality events, not only do equities decline but commodity prices also follow on the downside.
Weaker commodity prices are usually bad news for AUD and CAD, given that both nations are significant exporters of natural resources. Moreover, with JPY, CHF and EUR available as cheaper funding currencies, investors are probably not actively borrowing in AUD or CAD to lend elsewhere.
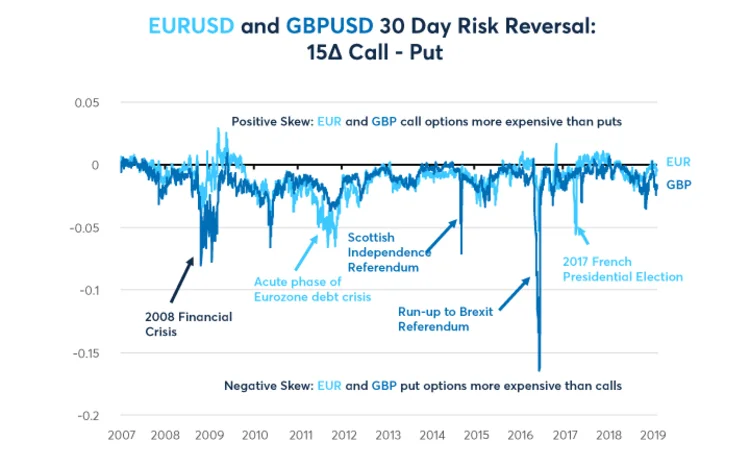
UK and Eurozone interest rates have been closer to the US than the other four countries – at least up until the recent tightening cycle. As such, interest rate gaps haven’t been as important a driver of the euro (EUR) and the pound’s (GBP’s) skewness versus USD.
Instead, politics has been a major driver of changes in call vs put skewness.
GBP was very negatively skewed versus USD in the run up to the referendums for Scottish independence in 2014 and Brexit in 2016. EUR showed extreme downside skewness during the acute phase of the Eurozone debt crisis back in 2011 and 2012, and once again in 2017 just before the French Presidential election.
Both currencies typically show negative skewness versus USD with OTM puts somewhat more expensive than OTM calls (Figure 5). This too reflects the central role of USD as the primary global reserve currency and a more likely beneficiary of a flight-to-quality rally than either EUR or GBP.
Looking at skewness to inform investment decisions
Do variations in skewness tell us anything about the future payoff of investing in currencies? Does extreme negative skewness send a buy or sell signal? What about extreme positive skewness? Does it mean that a currency is likely to head higher, or does it mean that its overbought and likely to fall?
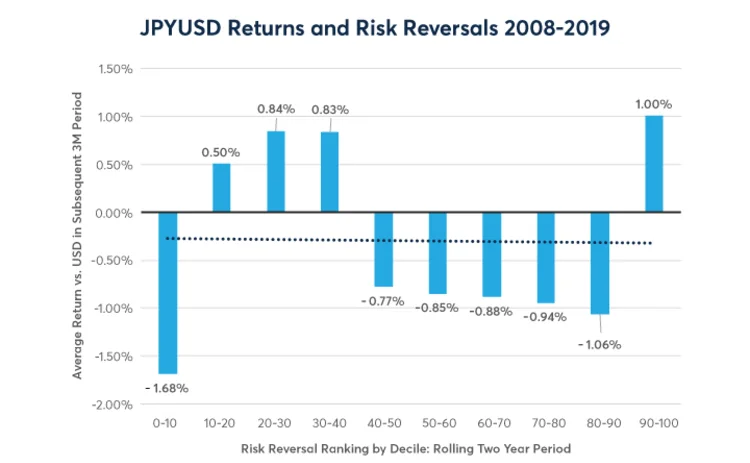
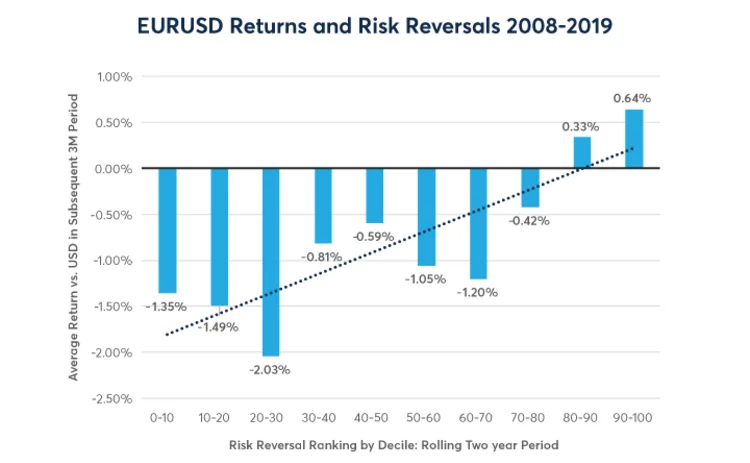
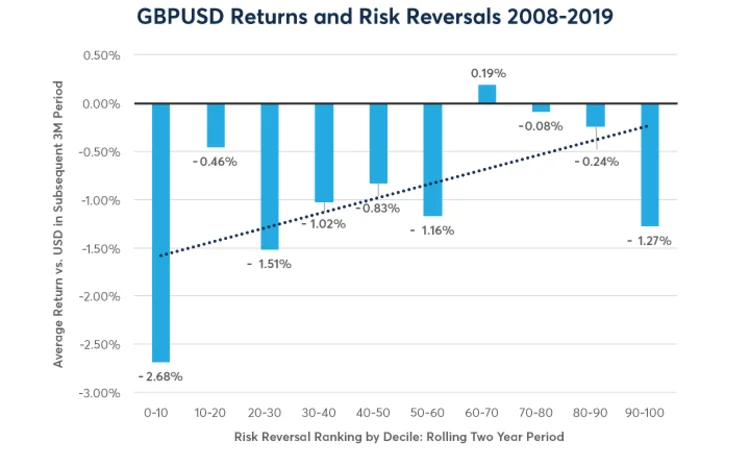
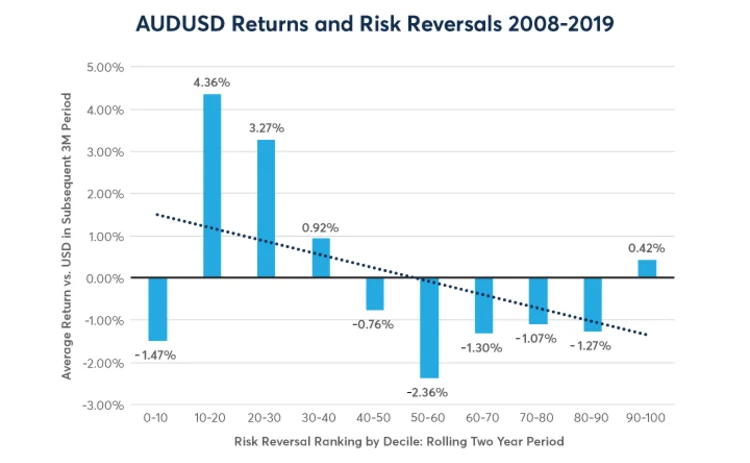
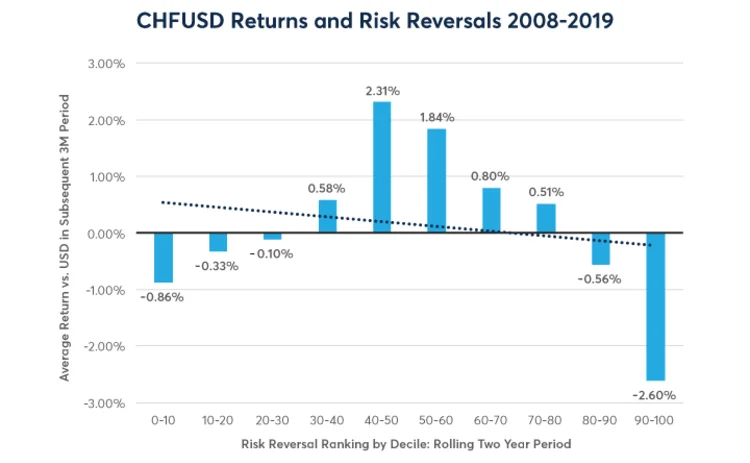
To answer these questions, we indexed the skewness on a scale of 0-100 over rolling two-year periods and compared it to the return of the currency versus USD in the subsequent three months (so there’s no look-ahead bias).
For example, if the currency option skewness was the most skewed to the downside it had been during the previous two years, the index would have a reading of zero.
If the currency option market was the most positively skewed that it had been during the past two years, the index would have a reading of 100. We then broke the results down into deciles and looked at the subsequent three- month performance of the reinvested currency future rolled 10 days prior to expiry from 2008 until early 2019.
The results paint a complicated story. For the CAD, EUR and GBP, options traders correctly anticipated risks much of the time. Extreme downside skewness was often followed by a plunge in the value of said currency – the Brexit referendum being the most famous case. By contrast, extreme upside options skewness tended to be followed by gains in the given currency (Figures 6-8).
For the Australian dollar, it worked the opposite way during our test period. Greater-than-average downside skewness was often a buy signal (though not the most-extreme downside skewness), whereas greater-than-average upside skewness tended to be a sell signal (though not the most-extreme upside skewness) (Figure 9).
For the two low-interest rate funding currencies, CHF and JPY, skewness wasn’t a good indicator of future returns (Figures 10 and 11). For the franc, this may be partly because its options happened to have an exceptionally positive skewness in 2011, when the SNB took the market by surprise by capping its value versus EUR at a lower level than where it had been trading.
This decision was extremely costly to anyone who was long the currency at the time and expecting further appreciation. After a long period of relatively average risk, with the options market neutrally positioned relative to its recent average, the SNB suddenly lifted the cap in January 2015, sending CHF soaring, putting a large upward bulge in the middle of our chart.
Had it not been for the SNB’s extraordinary interventions, the overall results for the franc would have looked much more like that of EUR and GBP.

The above results should be taken with a large grain of salt. Like any such analysis, it’s time sensitive and past average relationships should not be expected to hold in the future.
Nevertheless, options skewness might be something that currency traders, even those who don’t trade options themselves, might want to consider as they manage their portfolios. Moreover, traders may want to pay especially close attention when options skewness has gone to extreme levels one way or the other.
Bottom line
- Unlike equities or ag products, currency options don’t have a standard skewness.
- All else equal, investors tend to fear an abrupt rise in the USD than a sharp fell.
- Currency option skewness varies with interest rate differentials.
- EUR and GBP option skewness has been driven a great deal by political factors.
- Options skewness isn’t always a useful indicator of where currency values will head in the future but might be useful under certain circumstances and could be considered alongside many other factors that drive currency markets.
Sponsored content
Copyright Infopro Digital Limited. All rights reserved.
As outlined in our terms and conditions, https://www.infopro-digital.com/terms-and-conditions/subscriptions/ (point 2.4), printing is limited to a single copy.
If you would like to purchase additional rights please email info@risk.net
Copyright Infopro Digital Limited. All rights reserved.
You may share this content using our article tools. As outlined in our terms and conditions, https://www.infopro-digital.com/terms-and-conditions/subscriptions/ (clause 2.4), an Authorised User may only make one copy of the materials for their own personal use. You must also comply with the restrictions in clause 2.5.
If you would like to purchase additional rights please email info@risk.net

