An Exploration of the Evolution of Risk: Past, Present and Future
Nicholas C Silitch
Foreword
Introduction
An Exploration of the Evolution of Risk: Past, Present and Future
Risk Trading, Risky Debt and Financial Stability
Skating on Thinner Ice: A Macroeconomic Outlook at the End of the Credit Cycle
Climate Change: Managing a New Financial Risk
The Quest to Save Risk-Weighted Assets
The Evolution of the CLO Market since the Global Financial Crisis and a Valuation Approach for CLO Tranches
Homo Ex Machina: Finance Rebooted
Innovation and Digitisation in Credit: A Global Perspective
The Lending Revolution: How Digital Credit Is Changing Banks from the Inside
Digital Lending in Asia: Disruption and Continuity
Digitisation and Automation in Commercial Lending: Disruption without Distraction
Credit Risk Management in the Era of Big Data: From Measurement to Insight
Artificial Intelligence and Machine Learning in Credit Risk Analytics: Present, Past and Future
Integrated Loan Portfolio Modelling and Risk Management
The Role of Banks in Illiquid Credit Markets, and the Disruption and Evolution of Credit Portfolio Management
Epilogue
The shape and texture of debt instruments and portfolios have morphed materially since the early 1900s, and while this has changed the way credit risk manifests, it has not changed the foundational need for the analysis of each issuer’s business model, cashflows and balance sheet. What has changed is the ability to assemble broadly diversified portfolios of credit risk efficiently and economically; this is critically important when investing in instruments where the distribution of outcomes is severely limited on the upside and conceivably unlimited on the downside. This evolution has made it vitally important to understand the drivers of correlation, and how they may change through time, in assessing portfolios of credit risk. While for many the evaluation of correlations is limited to a mathematical exercise formed by the careful analysis of historical return data, this approach is inherently shortsighted. The data is inevitably limited to a much shorter time period than we would like: 10, 15 or 30 years. Consequently, the number of truly systemic events that occur within the lifespan of our data is limited. How do we enhance our understanding of what awaits us as we look to the future? By developing a thorough understanding of events that have changed the distribution of portfolio outcomes throughout history, and then using the insights gained from the analysis of those events to inform our understanding of what might affect portfolio outcomes as we look forward.
“Those who cannot remember the past are condemned to repeat it”: originally framed by philosopher George Santayana and often paraphrased or (mistakenly) attributed to Winston Churchill, truer words have never been spoken for the investment world. Happily, this is why grey-haired veterans with a historical perspective remain valuable in our line of work, and it is that perspective that we begin to explore here.
PAST: THE LONG MARCH FROM LOCAL TO GLOBAL CREDIT
The evolution of capital and commerce
We come from a world where geographic barriers are real: not just oceans and continents, but cities and towns. Banks, with a chequered history of deposit safety, served as the primary source for capital out of necessity, and were funded by local depositors. Why? No one would think of putting their hard-earned dollars into a bank that they did not know and that they could not reach easily. A banker in Peterborough, New Hampshire, might make a loan to a fellow from the next town, but would never make a loan to someone from the next county: capital aggregation and intermediation occurred locally.
Business models in the US prior to the 1900s were anchored in agriculture, an inherently local construct. As we move through the decades to World War II, while large shifts into manufacturing and other industries occurred, companies were still heavily labour dependent, and business models remained largely local. In essence, companies and capital were local with limited scalability and portability. Consequently, the underwriting of loans and bonds took place town by town, county by county and state by state, resulting in the characteristics of your portfolio looking a lot like your neighbourhood – in Oklahoma: drills, wells and oil patches; in a Maine coastal town: fishing, boat building and summer people. For the development of a true understanding of the risk profile, this arrangement was optimal, as financial data on these borrowers was, to be kind, limited and frequently non-existent. Financial statements were handwritten, typed (with manual edits) or, if you were lucky, printed and maybe audited. As a result, understanding the local business environment and drivers and knowing management were critical to individual underwriting and portfolio performance. Additionally, banks were locally owned and the people making the lending decisions were frequently investors in the bank, in effect putting their own capital at risk.
Understanding business models was anchored in the “five Cs” – capital, collateral, character, conditions and capacity – and adjudicated by loan officers who thought about careers in increments of multiple decades. This created a symbiotic relationship between loan officers and institutions, as both parties in effect owned the credit risk and benefited from safety and soundness through time.
Tailwinds of World War II
After World War II, geographic barriers began to disappear, not just town by town and county by county, but country by country. Transportation via automobile, ship and aeroplane became scaled and economic for the masses. Business kept pace, transcending geographic barriers through the wonders of advertising and the evolution of media (the Internet of its day). Henry Heinz had invented and started selling catsup (ketchup) in 1876 in Pittsburgh, Pennsylvania. With the advent of ad agencies, national media and, by the 1950s, television, Heinz became first a national company and then a global one – just one of many stories with a similar outcome.
Labour markets remained fundamentally changed after 1945, and participants were infinitely more mobile. Dislocation from men going off to war for six years had created opportunities for movement when they returned, and the notion of living in a town other than the one you grew up in no longer seemed strange; if you had left a small town in New Mexico, you did not have to return to it and your understanding of what was taking place around the country was much improved. While not contributing directly to the increased mobility of labour, during the war effort women had become meaningful participants in the workforce and were here to stay.
For capital intermediation, banks remained the focal point, but were changing rapidly through increased scale and broader regional and state presence. While local knowledge was still important, the combination of the Glass–Steagall Act and creation of the Federal Deposit Insurance Corporation (FDIC) insurance in 1933 had fundamentally changed the landscape for the future of capital intermediation in the US. First, it segregated market-making activities from fiduciary activities absolutely, ensuring better alignment for all stakeholders’ interests. Second, it removed the need for depositors to deposit only in local institutions and created stability and confidence in the banking system regionally, nationally and globally. As a result, capital formation began to break down the regional barriers, allowing for aggregation at both a regional and national scale in banks and insurance companies. These institutions could now meet the capital intermediation needs of rapidly growing regional and national companies. Third, it created a stable platform for the banking system which would serve a critical role in the economic expansion in the latter half of the 20th century.
Prior to World War II, public US fixed-income markets had been available exclusively to investment grade companies (eg, utilities and railways), requiring size and stability of the business model. Post-WWII, changing business models and the regional aggregation of capital led to broader access for industrial companies to these markets. However, they were still limited to investment-grade issuers and relatively illiquid.
1960s and 1970s: bell bottoms, balance sheets and bankruptcy
In the 1960s and 1970s (when, yes, bell bottoms were a thing) geographic barriers continued to diminish, public fixed-income markets became better established, benefiting from regulation and transparency, and the creation of “money center” banks led to further capital aggregation and a class of nationally and globally active banks. This phenomenon allowed the banking system to serve the continual evolution of business models as they went from local to regional to national and international with accompanying breadth in size and scale. Japanese, European, British and Canadian banks became increasingly active in US markets and US banks became active globally.
In spite of all of this progress and evolution, the underwriting of credit remained anchored in the five Cs, and the construction of portfolios for community banks remained local, just as regional banks remained regional, a reflection of their geographic footprint. National banks with global scale were able to diversify their portfolios further through lending to and servicing large companies globally, and through the emergence of syndicated bank credit facilities. However, the secondary markets for loans were undeveloped and therefore their portfolio remained largely the result of their own underwriting activity. A by-product of the growing scale of banks was the need for capital to support the growth in balance sheets, typically through public issuance of equity. Therefore, the notion of bankers investing their own capital disappeared for regional and national banks, and while the idea and aspiration for long-term careers remained for loan officers, incentives for management, now removed from ownership, frequently led to short-term income decisions at the expense of long-term stability, changing loan officers’ and bank managers’ agendas.
Capping the 1970s, in addition to hyperinflation and outrageous oil prices, which affected lives daily, came a little-publicised and poorly understood change to the laws around bankruptcy. The US Bankruptcy Reform Act of 1978 created pro-debtor options that allowed the management of companies to remain in substantive control for a prolonged period of time and individuals to file for bankruptcy with limited consequence. On the face of it, this provided many economic benefits, as employee bases and business models stabilised, individuals borrowed to create wealth and entrepreneurs were increasingly comfortable in taking the risks to drive innovation. However, it also removed, sadly, the stigma and much of the pain of bankruptcy, setting the stage for exponential increases in the levels of debt in the US from 1980 to 2019. The coming decades would see, in addition to remarkable economic growth, increases in default rates and a world where almost everyone (governments, companies and individuals) lived substantively above their means.
1980s: a crisis in three parts
Changing business models, tax codes and foundations of banking infrastructure, unsurprisingly, led to fractures in the US financial system. In many ways, the 1980s was a crisis in three parts: savings and loan (S&L)/real estate, emerging market debt and leveraged buyouts/junk bonds (Figure 1.1).
S&L/real estate crisis
Rapid growth in S&L balance sheets was facilitated by a deposit guarantee, light regulation and a competitive advantage for sourcing deposits over banks as they were allowed to pay interest, a construct enacted by the US Congress to encourage investment in real estate. What could go wrong? Everything. How badly? Epically: first, a remarkable rise in the value of real estate, then a remarkable rise in the amount of real estate, as construction dominated the skylines of all US cities and, lastly, a tax code that created “tax shelters” through depreciation constructs that incentivised the development of real estate that had little to no economic value. This led to a remarkable rise and then a dramatic fall in real estate values, which was exacerbated by the reversal of the tax rules in 1986. The 1980s represented a decade of real estate overbuilding, fuelled by the availability of capital and favourable tax treatment. By the end of the decade, S&Ls were in the rearview mirror, capital was scarce, a massive revaluation of real estate assets had occurred (which lasted through the early 1990s) and real estate bankers who remained in business had signs on their cubicles that read, “Please God, let there be another real estate bubble and I promise I won’t piss it all away this time!”.
Emerging market debt crisis
A substantial portion of a decade of balance-sheet growth from “money center” banks was invested in emerging market country syndications over fax machines, where virtually all the Cs of credit were unknown:
-
-
Capital of Argentina? And no, not Buenos Aires.
-
-
-
Collateral of Mexico? Full faith and credit? Until it was not.
-
-
-
Character of Brazil? Unknown as leaders changed annually, and many of the lenders had never even met them.
-
-
-
Conditions? Unbelievably appealing as the prospects for these countries were immense, and the debt bubble fuelled additional growth, leading to more lending.
-
-
-
Capacity of the Philippines? With 20/20 hindsight, clearly less than they borrowed.
-
While this crisis had material implications for the economic growth of these countries, caused rapid declines in their GDPs and almost brought Citibank and Chase Manhattan to their knees, it had the perverse and unanticipated positive effect of making these countries uncreditworthy, thus excluding them from the first 10 years of the 30-year debt party of the developed world and ensuring that what growth they had was anchored in fundamentals. This was painful in the short term, but would be beneficial as they looked to the future.
Leveraged buyout crisis
The leveraged buyout crisis became the first egregious misuse of data and analytics at scale, manifesting in the form of high-yield (“junk”) bonds and highly leveraged loans. Michael Milken’s application of history to this new asset class was proven to be shortsighted and flat out wrong. He and his Drexel Burnham Lambert team analysed loss data from non-investment-grade bonds that were attached to asset-rich, stable business models. This data was applied to a new class of borrowers with fleeting business models and extraordinary leverage. Rating agencies and investors were convinced that these new, highly leveraged volatile companies would behave identically in default and recovery to the fallen angels of yesteryear. Combine this with an unprecedented amount of global banks’ capital being made available to the US market with virtually no understanding of the five Cs of credit, and you create a fundamental imbalance for the demand and supply of loans (perhaps for the first time). All that was needed to complete this cycle was the whiff of a good, solid recession.
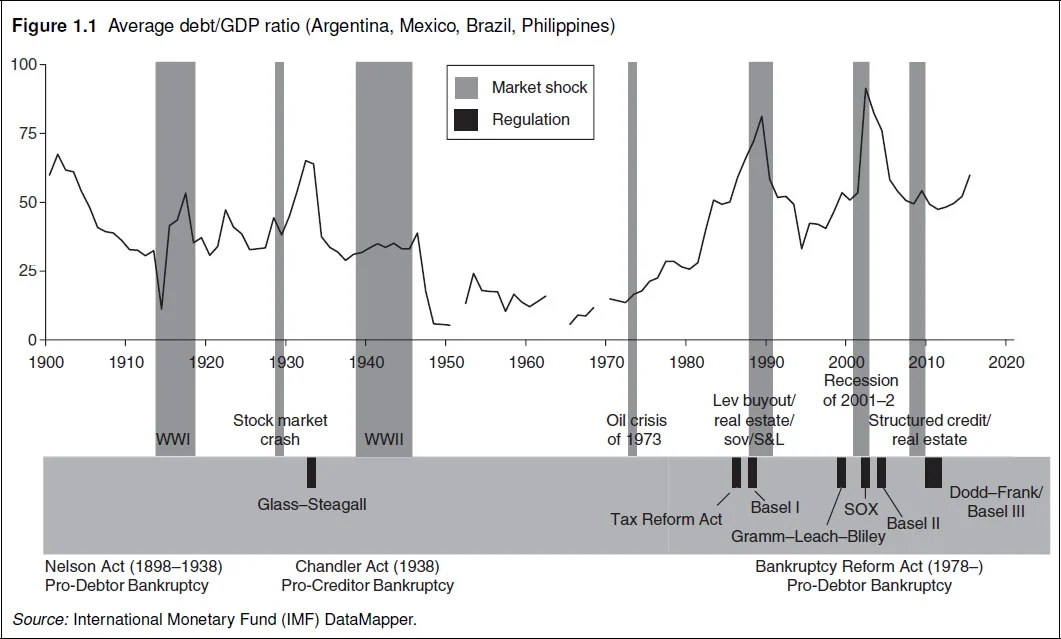

Contributing to this monumental misjudgement was, strangely enough, the first dividend for the financial business of desktop computing: in the 1960s and 1970s financial statements and projections had been handwritten or occasionally typed; the new world of Lotus-1-2-3 spreadsheets allowed us to run projections with printed outcomes that looked like the audited financials of old, which inspired confidence. The fact that the deal models would take the growth rates of strong economic times and extrapolate (if not enhance) them out for a decade, was disguised by the professionalism of the presentation. The folly of this approach was proven by the failure of many leveraged buyouts, and the deeply troubled times for the banks and institutions that held the loans and bonds. This was perhaps the first time model risk reared its ugly head – and unfortunately not the last. Markets have repeated this mistake again and again in the decades since, and the allure of using technology and data to justify “financial innovation” has continued unabated (see the leveraged loans and collateralised loan obligations (CLOs) of 2019).
Contradictory regulatory regimes helped to create an uneven playing field, riddled with loopholes. Regulatory constructs globally would treat the same loan differently through capital requirements, leading to our first instances of global capital arbitrage. Japanese and European banks could engage in US lending and financing activity with materially lower capital charges than US banks. An advantage? Maybe for the short term, but it would be detrimental to global financial stability in the long run. Global central bankers, through the Financial Stability Board (FSB), worried about this outcome, collectively put their heads together before the leveraged buyout crisis occurred and developed a new global banking regulation (Basel I in 1988) that ensured the capital requirement for a loan in a developed market was the same whether held by a Japanese, French, English or US bank. A good thing? Seemingly. The bad news was that the capital charges, while consistent, were at best ham-fisted, extremely blunt tools: 8% capital requirement for all funded loans, regardless of credit quality; 4% capital for multi-year committed facilities, regardless of credit quality; 0% capital for committed facilities under one year. So, while the banks were all behaving in the same way, they were not headed in the right direction. Holding 8% capital against high-grade short-term funded borrowings was uneconomic, resulting in the creation of a new asset class (financial innovation at its finest!): structured credit; the shadow banking system was born!
As a result, regulatory jurisdiction arbitrage shifted to asset class arbitrage. Now, high-risk assets with elevated returns stayed on bank balance sheets, as their yield could support the 8% regulatory capital load. Low-risk assets were increasingly securitised off bank balance sheets and distributed to investors with (frequently) as little as 2% capital to support the structures. Short-term corporate funding requirements for companies were met through the issuance of commercial paper with ratings bolstered by the backings of 364-day “committed credit facilities” that carried no capital from the banks but still left them with all of the credit risk should the company falter, plus the liquidity risk of having to have cash readily available to lend when markets were disrupted. Not our cleverest moment, and not the regulators’ best day. The good news is that it is impossible to blame the credit cycle of 1989–91 on Basel I, as it was late to the party. In fact, one of the reasons for the development of Basel I was the regulators sensing the increasing imbalance in global credit markets. The bad news (maybe even very, very bad news), one could argue, is that without Basel I, the 2007–9 Great Recession would never have happened.
Not that the regulators were the only ones at fault here, but the avarice of bankers and investors, with rating agencies complicit, combined with a capital construct insensitive to risk, caused incredibly destructive outcomes. While we all know how this ended, let us examine its creation: commercial mortgage-backed securities, mortgage-backed securities, CLOs, collateralised debt obligations (CDOs), CDO-squareds and CDO-cubeds were the stepchildren of the initially innocent receivables securitisation transactions done in 1988, spurred on by the impending new capital regime. Our quixotic misadventure may have started slowly, but by the late 1990s it would become a tidal wave.
1990s: data and innovation
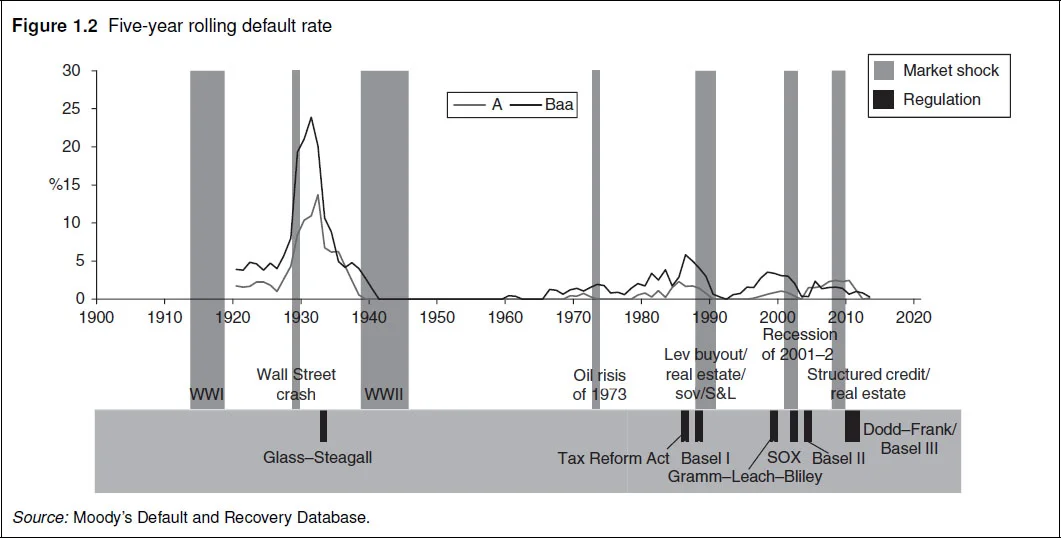
The move into structured credit created the need for models, and data to drive them, so that we could measure and price our risk. Our fundamental problem was that we did not have enough data to even begin to define tail outcomes. The data we possessed on defaults, recoveries and asset prices was not captured or collected for broad asset classes prior to the early 1990s. Yes, we had Moody’s default data for corporate bonds that went back beyond the Great Depression (Figure 1.2). And David Keisman had begun his heroic adventure of extracting recovery data on public bankruptcies back to the late 1980s. However, even with that data, the picture was largely incomplete, as we had only 10, maybe 15 years of default data for loans and private debt. Additionally, rating agencies’ data was limited because most companies that issued debt before 1970 were investment grade and that universe was small. By definition, investment grade companies default infrequently and, even with the database going back to 1920 and including the Great Depression, the years between 1920 and 1999 did not yield a lot of defaults.
Adding to our data challenge, metrics for the rating process at the rating agencies evolve, as do business models. US bankruptcy laws were rewritten in 1978, which makes the data captured prior to this less relevant. Additionally, this data was influenced by macroeconomic factors unlikely to recur in the investible future. Global GDP during the decades after World War II grew in excess of 5% per year, a huge tailwind for valuations and business models. Yes, we had a recession in the 1970s, but global growth continued, and in 1981 the 30-year Treasury interest rate rose to a peak of almost 16%. For the next 31 years, interest rates declined, providing a new source of tailwinds for global valuations. Even if all the data were stable and dependable, we would not have had enough to truly define tail distributions. Remember, our definitions of tail outcomes include an “Aa” confidence interval of 99.95%, a five-basis-point (5bp) probability of default: 5 in 10,000! Ten thousand what: years (the Roman Empire was roughly 2,000 years ago)? Days? Months? Companies (there are approximately 80 “Aa” issuers in Bloomberg–Barclays US Aggregate Index)? Cycles? Who knows? But, investors, modellers and rating agencies seem to assume that the 5bp are measured over a one-year period and that the default rates will be low for a long time. The reality is that, even at the time of writing, we do not have enough data to define these tail distributions in a credible way. And thus, the structured credit market, which provides access to leveraged credit returns as we move away from the last loss positions, is increasingly becoming a game for gamblers, not fiduciary investors.

The proliferation of new and exciting asset classes needed a framework for ranking. The seemingly logical choice was to adapt tried- and-true agency ratings. This way, the new asset classes could fit neatly into reports, investment mandates and regulatory frameworks. Sadly, to the market’s continued detriment, a single agency rating is not capable of representing a full risk distribution. Agency ratings were built for corporate bonds and are generally calibrated to represent an average expectation of loss (through default and recovery). Structured products have wildly different risk distributions to corporate bonds – in particular, mezzanine tranches have materially “fatter” tails. This distinction, while incredibly important in defining and quantifying tail outcomes, continues to be largely ignored by regulators, investors and rating agencies because of the complexity of defining a solution for the problem and the modelling challenges.
Was this a compelling reason to stop? Of course not! Regulators worldwide felt incredible comfort if their regulated entities invested in “Aa” exposures and provided huge capital incentives for these types of investments. With few “Aa” companies in existence, and very low yields and spreads from investing in Treasuries, historically, “Aa” investments were hard to find. With the advent of structured credit, we could take a portfolio of “Baa”, “Ba”, “B”, “Caa”, “Ca” exposures and, through tranching losses, convert 70% of that portfolio to a “Aaa” asset: in simpler terms, this is like taking a portfolio of donkeys and making a unicorn. For bank investors, these exposures absorbed very little regulatory capital as Basel I deemed them to be 20% risk-weighted (1.6% capital instead of 8%). For insurance investors, these worked for similar regulatory reasons. In essence, regulators provided an inexhaustible demand for these assets and structures. And these exposures worked for fiduciary investors of all shapes and sizes, as their stakeholders, including the rating agencies and regulators, had built their expectations and their ratings grids thinking of historic corporate bond losses in an unleveraged context, vastly different from structured credit outcomes.

For investment bankers, regulatory arbitrage opportunities of this size and scale were a massive opportunity. The opacity of the risks inherent in the structured tranches made the rating and the pricing a guess at best, leaving plenty of room for bankers to skim yield as compensation for their structuring. Fixed-income sales and trading went from being modest second cousins in the investment banking hierarchy to being kings of the castle. This was perhaps the most lucrative decade ever for these gentle citizens. It was also profitable for the firms they worked for, at least in the short run, until you valued appropriately the equity tranches that remained on the balance sheet, which could not be syndicated. Investment bankers with an insane opportunity to print money, and investors incentivised by regulatory views and capital constructs: what could go wrong?
We cap the 1990s with the Gramm–Leach–Bliley Act of 1999, which effectively repealed the economic safeguards of the Glass–Steagall Act. In 1933 the Glass–Steagall Act forced a separation of market-making and fiduciary roles, a powerful protection mechanism for consumers that served markets in good stead for 60 years. But in the 1990s, investment bankers, driven by short-term bonus incentives, were connected to fiduciary balance sheets – a recipe for disaster? Considering that finance in the 1990s was so characterised by reckless trust in historical data, it is somewhat ironic that the crowning legislation chose to completely ignore the history that led up to the Great Depression and the lessons learned.
2000s and 2010s: lessons learned?
While all of this was going on, the US economy was increasingly being disrupted by technology. In 1994, almost no one owned a mobile phone. By 1998, they were ubiquitous. By 2002, we had connected them to the Internet and started the true digital transformation of many of our day-to-day functions. This did not always go smoothly as investors have frequently overestimated potential in undefined business models, which led to the tech bubble burst of 1997 and the emerging telecoms disaster that removed billions of US dollars from the investible universe.
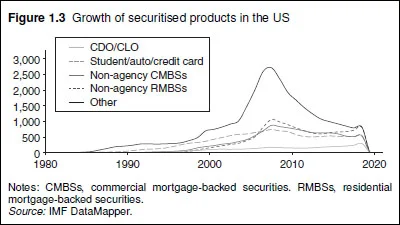
The early stages of the 2000s looked much the same as the end of the 1990s: structured credit continued its emergence (Figure 1.3) and technology continued to change the way we thought about almost everything. People, continuing to be people, engaged in idiosyncratic frauds and accounting malfeasances (eg, Arthur Andersen, Enron and WorldCom). US politicians, continuing to be politicians, would dive in after the fact to save the day with the 2002 Sarbanes–Oxley Act (“SOX”).
By 2004, the growth in structured credit, fuelled by inexhaustible demand for these assets and for the income that flowed into investment banks’ and bankers’ coffers, led to increased pressure to find assets to put into these structures. CDO-squareds and CDO-cubeds solved part of the problem, as the increased leverage led to even more opacity in pricing and continued to line banks’ and bankers’ pockets. For mortgages, this led to lower quality underwriting in the collateral for both commercial and residential banking. Growth in leverage for the prime brokerage and market-making activities at the major investment banks that supported leveraged investment structures for hedge funds added fuel to the fire.
The beginning of the end
By 2007, Bacchus was getting weary from a decade of excess, and markets began to show the signs of collapse. Asset values, built up by decades of leverage and capital availability, started to waver, leading to the erosion of collateral for many of the structured credit solutions as well as margin calls (liquidity events) for leveraged investors. This led to sales into declining markets, which further depressed values – a train that is hard to stop. By the end of 2008, the S&P 500 had bottomed out at 666 and the markets were in freefall (the Great Recession), requiring government bailouts and assistance for capital markets, institutions, companies and consumers. Lessons learned? Markets and things that affect markets (regulations) can be systemic. Actions taken? Some were remarkably on point, such as dramatically reducing the leverage within prime brokerage activities and requiring the duration of securities financing to be extended to greatly reduce the likelihood of another 2008. Some were less effective, as the difficulties posed in regulating markets led to the less optimal outcome of more regulations heaped upon financial institutions, which are not in and of themselves systemic. Failing financial institutions are a symptom of systemic events, but the root causes of those events lie in the markets, and in the regulations that either affect them or drive consistent, misguided behaviour by financial intermediaries. Not that there is not plenty of blame to go around when we look to episodes of financial instability, but at the core, outcomes would have been manageable had we instituted macroprudential policy around loan-to-value requirements to cool an overheated mortgage market, or not created and fuelled the shadow banking system and structured credit through a well-intentioned though misguided Basel I.
PRESENT: LEVERAGE AND DENIAL
Have we learned our lesson? Let us examine the regulatory outcomes after 2008. The safety and soundness of banks and market participants became paramount, leading to all forms of risky assets no longer being held by banks. Capital levels for these institutions were now fortress-like. The next crisis will not stem from a bank failure. If this were the only standard we were concerned with, we would be in great shape. Unfortunately, it is the safety, soundness and stability of the financial system, not the safety, soundness and stability of banks that eliminates financial catastrophe. How are we doing on this metric? Let us examine this further.
Structured credit, which was at the epicentre of the 2008 crisis, continued to prosper. While collateral tranching and documentation for mortgages were greatly improved, sadly, this is not the entire story. Initially, structured credit and the shadow banking system, children of Basel I in 1988, were constrained to high-grade receivables financings. They now spanned virtually all types of collateral, including the riskiest of assets and asset classes. Why is this a problem? Illiquid assets such as leveraged loans and mortgages, which were traditionally originated and held by sources of long-term, stable liquidity (regulated banks and insurance companies), were now, through these structures, held by institutional investors and money funds broadly motivated by relative investment returns with high portfolio turnover. Many of these sources of funding do provide liquidity in stable environments, but as markets become stressed buyers will become scarce while sellers, led by retail investors, will become omnipresent. In short, we transferred much of the financial risk from regulated entities to a broader pool of investors, many of whom are retail or represent retail investors’ interests. From the perspective of bank regulators, this is a good idea. From the perspective of regulators of the financial system, this is a bad idea, one likely to lead to dramatically more volatility in the next downturn.
Of particular concern is the growth of the leveraged loan asset class, which has continued unabated, fuelled by a virtually endless demand for highly rated, high-yield, floating-rate assets and the regulatory constraints for bank lending. Here again, we are affected by the challenges of data, as the secured loan database only dates back to the late 1980s, when business models, leverage levels and collateral structures were materially different. Much of the default data comes from that period, when leveraged loans typically represented twice the annual cashflow, had a substantial subordinated debt cushion and had very small carve-outs for other secured creditors. Metrics on leveraged loans originated today represent four times the annual cashflow (as adjusted for pro forma outcomes), frequently have a second lien creditor behind them and have a carve-out for other secured creditors including mortgages and financiers of receivables and inventory. Adding to the complexity of comparing loans in the database with loans being originated today is that a substantial portion of the value of the borrower’s business model now comes from intangibles such as brand name and reputation, with tangible asset activities such as manufacturing and distribution being outsourced. As a result, companies of material size can be created in a relatively short time; however, their spot in the value chain can also be replaced with minimal friction. Surely we have learned from the lessons of Michael Milken in the late 1980s? We would never again take data that applied to one type of borrower and overlay it on another to justify an investment decision – would we?
The fixed-income investor of the late 2010s has been playing in credit markets, drunk on their own excesses. Leverage has been hitting historical highs, particularly in investment grade corporate credit and bank loans. Covenants and other lender protections are becoming less constrained in the loan market, bowing to the need for just a little more yield. Rating agencies have been straining under the need to bucket disparate assets under the same rating framework. All this has been triggered by a long global malaise and an unwinding of the extraordinary tailwinds for asset values since World War II.
The global sustained and broad-brush expansion of GDP was first driven by the recovery of post-War economies and more recently through an extraordinary expansion in global debt. In addition, interest rates have been steadily declining since 1980. Unfortunately, these tailwinds have run their course. The next bubble could make the 1990, 2002 and 2008 crises look relatively tame. Leveraged loans are true to their name, as leverage metrics in the late 2010s were at all-time highs against all-time highs in asset values. Investment grade corporates were also at all-time leverage highs. The picture for liquidity implications, not the prettiest at the best of times, is even worse. “Baa” debt in the Bloomberg Barclays US Aggregate Index exceeded US$2.6 trillion at the time of writing in 2019 and represented half of the investment grade index, much higher than ever before, with record leverage for the ratings. Unfortunately, the one market that had not grown (because the demand for the asset class is limited) is high-yield bonds. The problem with this is that ratings are temporal and likely to decline with a global slowdown and the leverage metrics in place. Because of the lack of demand for high yield, if even 10% of the “Baa” bonds became downgraded to junk, we would have a 15% increase in available high-yield bonds, with virtually no demand as constructed at the time of writing. The development of a large additional supply of high-yield bonds without the symbiotic creation of demand will create a liquidity squeeze for high-yield debt. The adverse consequences will affect all save the distressed investors who sadly do not and will not have the capacity to absorb this wave. So the demand and supply equations could be fundamentally altered for corporate debt. Additionally, in the loan market, as loans roll over every three to five years, retail investors, who now represent a substantial portion of leveraged loan investors, are likely to disappear in times of distress. Who will provide rollover financing for these maturities? If it is banks, the leverage levels will be materially lower. The virtuous cycle of increasing leverage levels, leading to values as defined by increasing multiples of cashflow, will be replaced by declining leverage levels and reducing values.
Perhaps the regulators will pat themselves on the back as the meltdown occurs and banks are not at the epicentre. Unfortunately, the dangers still exist and regulators will have no way of reversing this collapse. Regulators cannot force retail and institutional public investors to stay. Additionally, this is likely to bleed into the economy as the inability to refinance loans will drive down asset values and perceived wealth. Such a correction would require cost-cutting actions across the board for corporates. This could come back to haunt regulators as the shadow banking system, created by the invention of Basel I, melts down spectacularly. Regulators would be powerless to stop it.
If they have no ability to intervene at the micro level, perhaps they can pump liquidity into markets and asset values by macroeconomic adjustments, lower interest rates and simply printing money. This will be hard to do with rates where they were in the late 2010s, and with the existing quantitative easing programmes in place to help keep the economy vibrant in good times. Perhaps we could provide liquidity backstops for leveraged loan mutual funds and downgraded corporate bonds, effectively nationalising them. It would only take US$300 billion to US$400 billion for the CLOs and a similar amount for the downgraded corporates. Ouch!
In reality, our alternatives for a bailout become hard to imagine and difficult to execute. Our collective dry powder was spent on many transgressions since 1990 and is now largely gone.
FUTURE: FISCAL CONSEQUENCES, BUSINESS MODEL EVOLUTION, CLIMATE CHANGE
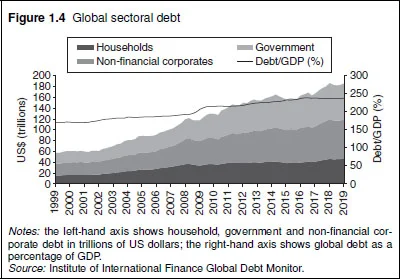
We live in a world that is awash in debt across all asset classes. According to the Institute of International Finance, global debt rose from US$85 trillion in 2000 to US$243 trillion in 2018 (Figure 1.4), representing over three times the GDP – levels of debt that are nearly unserviceable, even with historic low rates, and a growth rate that is unsustainable. The tailwinds to asset values from low interest rates and extraordinary growth in global debt will fade as we enter the 2020s, to be replaced by a world where asset values are in long-term decline as tax regimes for developed markets become increasingly asset-focused to try to meet the rapid arrival of entitlements becoming cash obligations.
At some point by around 2030–35, the US will need to come to terms with its fiscal situation. Its addiction to both direct debt and entitlements at the state, municipal and federal levels is unsustainable. Income taxes, property taxes, healthcare and promises to pensioners will all need to be scrutinised. State and municipal governments continued to add to the fundamental imbalances in their budgets by making promises on the pension and benefit fronts that did not show up in the budget numbers at the time of writing. This will be an unbearable burden for future generations, and is likely to create severe volatility, as some of the worst offender cities and states will have to immediately restructure the shape of their tax and disbursement schemes.
Student loans, worth almost US$1.5 trillion in mid 2019, will become a real problem for the US taxpayer, with many borrowers becoming burdened by payments that their income cannot support. And many of the schools receiving the proceeds of the loans are at best not fit for purpose, offering limited educational value as they absorb tuition dollars funded by government guarantees.
Meanwhile US politicians are unwilling, or unable, to make difficult decisions about reducing the availability of these loans to people with real academic agendas, or to deal with necessary reform. What are the implications for long-term investors in debt and equity? Can our economies continue to grow without our current reliance on debt?
The US financial situation puts at risk the role of the US dollar as the global reserve currency. This would be a catastrophic event for the global economy and would be felt most acutely in the US. Volatility, rates and asset values are all impossible to predict. Large amounts of real deflation will become more likely as the economy forces lower valuations for labour, but questions remain. Will this be offset by nominal inflation as the value of the dollar declines against its global partners? Perhaps.

Business models have always been temporal; however, the pace of change has accelerated since the millennium, and the speed and scale of change continue to increase. It took railways and horses decades to be replaced by the internal combustion engine, and the Blackberry just over a decade to rise to global prominence and fall to obscurity. Globalisation, pricing transparency and unprecedented access to information have ensured that disruptive innovation is instantly rewarded with access to capital (eg, Uber and Tesla), customers (eg, Apple, Uber, Etsy, Amazon) and scale, as outsourced manufacturing and distribution capacity is seemingly instantly available and digital distribution is immediate. As a result, the adaptive reaction of the global economy and marketplace to innovation is rapid and broad-based, creating untold opportunities for wealth creation, and lowering the cost and shortening the time frame for incubation. Additionally, the focus has become all-consuming and the tools at hand to drive progress are increasing in power daily. In 1900, people were still largely occupied with avoiding starvation and disease on a daily basis, making innovation accidental or the province for the moneyed few and the extraordinarily passionate. Today, access to data and technology to support innovation is unprecedented: mapping DNA sequences has gone from something that could only be done on supercomputers to something college students can do in class.
The challenges this increased access to technology presents for the fixed-income investor are myriad, as the profile of returns is asymmetric and the duration of an investment can extend to 30 years. If all goes perfectly, coupon and principal are received; if not, losses that can reach 100% of your investment put a premium on the analysis of the markets, industries and companies that you are invested in and makes index investing less appealing, as in many cases the largest segments of the index are made up of mature business models more susceptible to disruption. The bottom line, forward thinking and constant analysis become the key to success through time, and investors who curtail this approach due to the expense will fall short.
Finally, the changing financial and business environment is real. Investment professionals are people who strive to understand the ecosystems within which companies operate on the micro level. We have discussed the increased challenge and complexity of this as we merely adapt to the escalating pace of change. Now add to that the challenge of understanding the societal and public policy implications of global warming. How should one think to evaluate the future for the utility industry? For certain, the next 30 years are likely to look a lot different than the last 50, but will policies be responsibly adapted, or politically driven and reactive? What are the implications for population centres on coastal plains (eg, Miami, New Orleans, New York, Boston)? Will this increase the speed of change as economic realities are altered through public policy and regulation such as carbon taxes and limits? What are the implications of electric vehicles being broadly adopted – for the automotive industry, the petroleum industry and on convenience stores?
In short, there is much to think about as we ponder the future – both as citizens facing myriad fiscal and societal decisions to create a sustainable economic and natural environment through responsible macro policies, and as investors, as we navigate a down cycle driven by excessive corporate leverage and asset valuations going through the inevitable process of mean reversion (does anyone have a crystal ball as to timing?): all of this as we grow accustomed to a world where large-scale change and disruption are the new norm, bringing the possibilities of increased risks and rewards, with volatility being perhaps the only certainty.
Only users who have a paid subscription or are part of a corporate subscription are able to print or copy content.
To access these options, along with all other subscription benefits, please contact info@risk.net or view our subscription options here: http://subscriptions.risk.net/subscribe
You are currently unable to print this content. Please contact info@risk.net to find out more.
You are currently unable to copy this content. Please contact info@risk.net to find out more.
Copyright Infopro Digital Limited. All rights reserved.
As outlined in our terms and conditions, https://www.infopro-digital.com/terms-and-conditions/subscriptions/ (point 2.4), printing is limited to a single copy.
If you would like to purchase additional rights please email info@risk.net
Copyright Infopro Digital Limited. All rights reserved.
You may share this content using our article tools. As outlined in our terms and conditions, https://www.infopro-digital.com/terms-and-conditions/subscriptions/ (clause 2.4), an Authorised User may only make one copy of the materials for their own personal use. You must also comply with the restrictions in clause 2.5.
If you would like to purchase additional rights please email info@risk.net


