
Monthly swaps data review: basis swaps galore
Data shows how less well-traded OTC instruments performed through September

When analysing flows in the over-the-counter derivatives market, it is easy to focus on the most widely traded products such as plain vanilla interest rate swaps, overnight index swaps (OIS) and credit index swaps.
However there is more to the derivatives markets than these products. Basis swaps in particular are important segments of the market in a number of currencies, so it is worth taking a deeper dive to see what trends can be identified.
US derivatives
US swap data repository (SDR) data can be used to aggregate trade counts for all interest rate derivatives products traded by US entities. Doing this for the six largest currencies for the first three weeks in September gives us the following results.

Table A shows:
- Fixed-to-floating interest rate swaps are the most well-traded products in each currency.
- US dollar-denominated trades dominate for all products, as this is data reported by US entities.
- Australian and Canadian dollar, sterling and yen trades are all fairly similar, while euro trade counts are substantially higher.
- OISs are significant in US dollar, euro and sterling, as I have mentioned in previous articles.
- Swaptions are well traded, as I mentioned in April.
It is useful to look at some of these categories in greater detail.
Interest rate basis swaps
These are interest rate swaps where both sides are floating and linked to a different index. The 804 US dollar-denominated trades in this three-week period can be categorised into the following types: one-month Libor vs three-month Libor with 322 trades; Fed funds vs three-month Libor with 271 trades; and three-month Libor vs six-month Libor with 186 trades.
Other US dollar indexes such as the Securities Industry and Financial Markets Association (Sifma) and Bond Market Association’s (BMA) muni swap indexes and the Prime index each have fewer than five trades.

Figure 1 shows:
- Trade counts by tenor for one-month Libor vs three-month Libor.
- Five years is the most common tenor, followed by one year.
- A Libor one-month curve can be derived out to 30 years from a Libor three-month curve.
Cross-currency basis swaps
The most common cross-currency swaps are euro/US dollar, where one side references three-month Euribor and the other references three-month Libor.

Figure 2 shows:
- One, two, five and 10 years are the most traded tenors.
- There were a total of 490 trades and over $92 billion in gross notionals.
- This trading activity is shown in the movement of the euro/US dollar cross-currency basis. As of September 22, the basis spread was –3bp at the short end, –38bp at 10 years and –21bp at 30 years.
Inflation swaps
In the inflation swap market, the US consumer price index, UK retail price index and Europe’s harmonised index of consumer prices ex-tobacco are the major indexes traded.

Figure 3 shows:
- The range of tenors that traded from one year to 30 years in the three-week period.
- One, five and 10 years are the most traded tenors.
- A total of 368 trades were executed, with more than $18 billion in gross notionals.
Caps and floors
Caps and floors are strips of interest rate options that reference an interest rate index. A surprisingly decent number of these are traded in US dollars; surprising as US dollar swaptions are such a large market that they dominate option trading in the asset class.
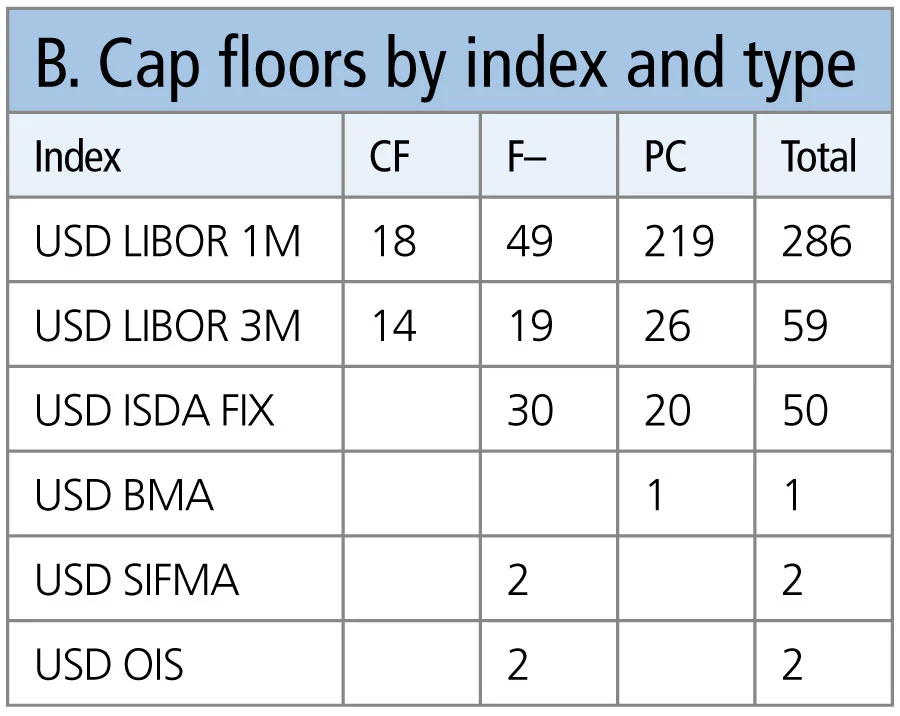
Table B shows:
- One-month Libor is by far the most common reference index.
- Collars, floors and caps are the types traded.
- Isda Fix, which is now known as Ice Swap rate, also has a reasonable number of trades.
- There are a handful of trades in other indexes.
Exotics
Anything with the name ‘exotic’ is bound to attract attention. Unfortunately, while there are 1,027 trades specified as exotic, the data format and data published on these is lacking in detail.
Among the types that can be distinguished are:
- Variable notional swaps.
- Constant maturity swaps – which includes constant maturity treasuries.
- Spread options.
- Callable swaps.
- Embedded options.
- Indexes.
However, the data does not allow meaningful characteristics and counts of these to be collated – we can only analyse the numbers of trades that take place and generic fields like execution time and notional.
Regulatory reporting needs a feedback loop, so that as the industry starts to understand and make use of public data, it drives a process to improve formats and quality of disclosure. Is that too much to ask? Probably.
Amir Khwaja is chief executive of Clarus Financial Technology.
Only users who have a paid subscription or are part of a corporate subscription are able to print or copy content.
To access these options, along with all other subscription benefits, please contact info@risk.net or view our subscription options here: http://subscriptions.risk.net/subscribe
You are currently unable to print this content. Please contact info@risk.net to find out more.
You are currently unable to copy this content. Please contact info@risk.net to find out more.
Copyright Infopro Digital Limited. All rights reserved.
As outlined in our terms and conditions, https://www.infopro-digital.com/terms-and-conditions/subscriptions/ (point 2.4), printing is limited to a single copy.
If you would like to purchase additional rights please email info@risk.net
Copyright Infopro Digital Limited. All rights reserved.
You may share this content using our article tools. As outlined in our terms and conditions, https://www.infopro-digital.com/terms-and-conditions/subscriptions/ (clause 2.4), an Authorised User may only make one copy of the materials for their own personal use. You must also comply with the restrictions in clause 2.5.
If you would like to purchase additional rights please email info@risk.net
More on Comment
Markets never forget: the lasting impression of square-root impact
Jean-Philippe Bouchaud argues trade flows have a large and long-term effect on asset prices

Podcast: Pietro Rossi on credit ratings and volatility models
Stochastic approaches and calibration speed improve established models in credit and equity

Op risk data: Kaiser will helm half-billion-dollar payout for faking illness
Also: Loan collusion clobbers South Korean banks; AML fails at Saxo Bank and Santander. Data by ORX News

Beyond the hype, tokenisation can fix the pipework
Blockchain tech offers slicker and cheaper ops for illiquid assets, explains digital expert

Rethinking model validation for GenAI governance
A US model risk leader outlines how banks can recalibrate existing supervisory standards

Malkiel’s monkeys: a better benchmark for manager skill
A well-known experiment points to an alternative way to assess stock-picker performance, say iM Global Partner’s Luc Dumontier and Joan Serfaty

The state of IMA: great expectations meet reality
Latest trading book rules overhaul internal models approach, but most banks are opting out. Two risk experts explore why

How geopolitical risk turned into a systemic stress test
Conflict over resources is reshaping markets in a way that goes beyond occasional risk premia
