
Credit data: worrying trends in sovereign risk
All signs point to a more volatile environment for sovereign credit risk

Sovereign credit risk is a complex beast. It is often country-specific, but can also be driven by regional and global themes.
Currently, all three factors are in play.
Venezuela is in a state of near-total economic collapse. Argentina, which sold a 100-year bond in 2017 after emerging from default the previous year, is gearing up for a critical election in October. A split decision in Turkey’s recent local elections offered little reprieve for the country’s already fragile economy.
At a regional level, oil producers in the Middle East face a common problem. The conflict in Libya and tougher sanctions on Iran have pushed up oil prices, with Brent crude trading at $74 a barrel on April 25, up from around $50 at the start of the year, but the US shale boom is flooding the market with a glut of oil supply, and Saudi Arabia needs oil prices above $80 a barrel to balance its budget. The credit risk of the Organization of the Petroleum Exporting Countries sovereigns has risen 30% since December 2016 and will remain elevated unless oil prices can sustain higher levels.
Meanwhile, Chinese sovereign risk deteriorated 15% last year after the US slapped tariffs on imports.
The problems are not confined to emerging markets. Sovereign credit risk in developed countries improved steadily from early 2017 but has deteriorated over the past six months. Monetary tightening and slowing economic growth are having a negative effect, at least in the short term.
Looking ahead, changing geopolitical alliances, trade flows and supply chains will have a more profound and far-reaching effect. It all adds up to a more volatile environment for sovereign credit risk. From mid-2017 to late 2018, sovereign credit volatility more than doubled. And while it has come down recently, sovereign credit volatility remains worryingly high, at just above 4%.
Global credit industry trends
The latest bank-sourced credit data, based on 30+ financial institutions, shows upgrade and downgrade activity has decreased, with 39 companies moving more than one notch, compared with 62 companies the previous month. Figure 1 shows detailed industry migration trends for the most recent published data, based on data adjusted for changes in contributor mix.
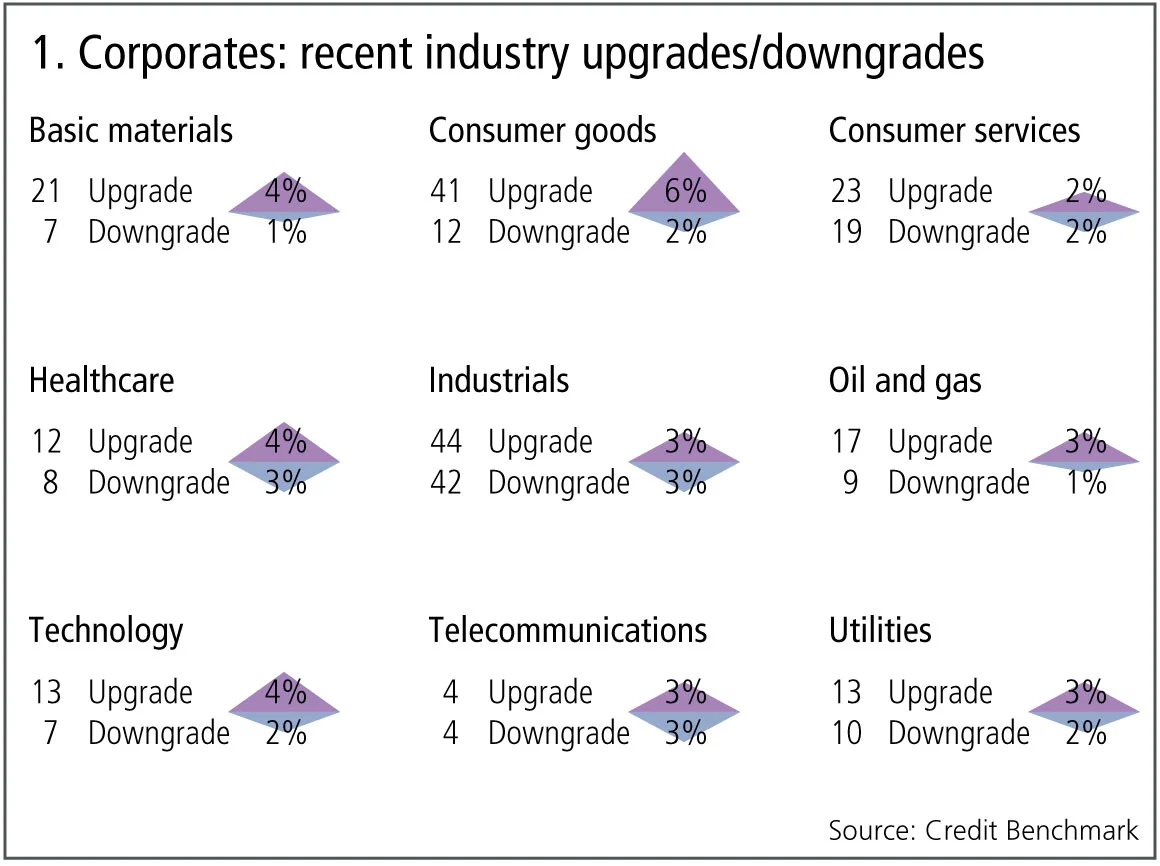
Figure 1 shows:
- Globally, the number of corporate upgrades outweighs the number of downgrades.
- Upgrades outnumber downgrades in seven of the nine industries and there are no industries where downgrades dominate.
- Basic materials, oil and gas and utilities continue their multiple month trend of upgrades dominating.
- After three months of balance, consumer goods upgrades outnumber downgrades in a ratio of 7:2.
- Technology and health care return to upgrades outweighing downgrades after a month of balance.
- Consumer services are in balance after three months of downgrades outweighing upgrades.
- Telecommunications are in balance after four months of downgrades dominating.
- Industrials continue to be in balance for the second month.
Sovereign credit risk
Sovereign credit risk is a high-profile and sensitive topic. Changes in government funding rates affect the lives of millions of citizens and controversial rating decisions can damage investment portfolios. Recent economic developments have pushed sovereign risk back into the spotlight due to a combination of global, regional and country-specific factors.
Figure 2 shows the median rolling six-month volatility for 100+ sovereigns.
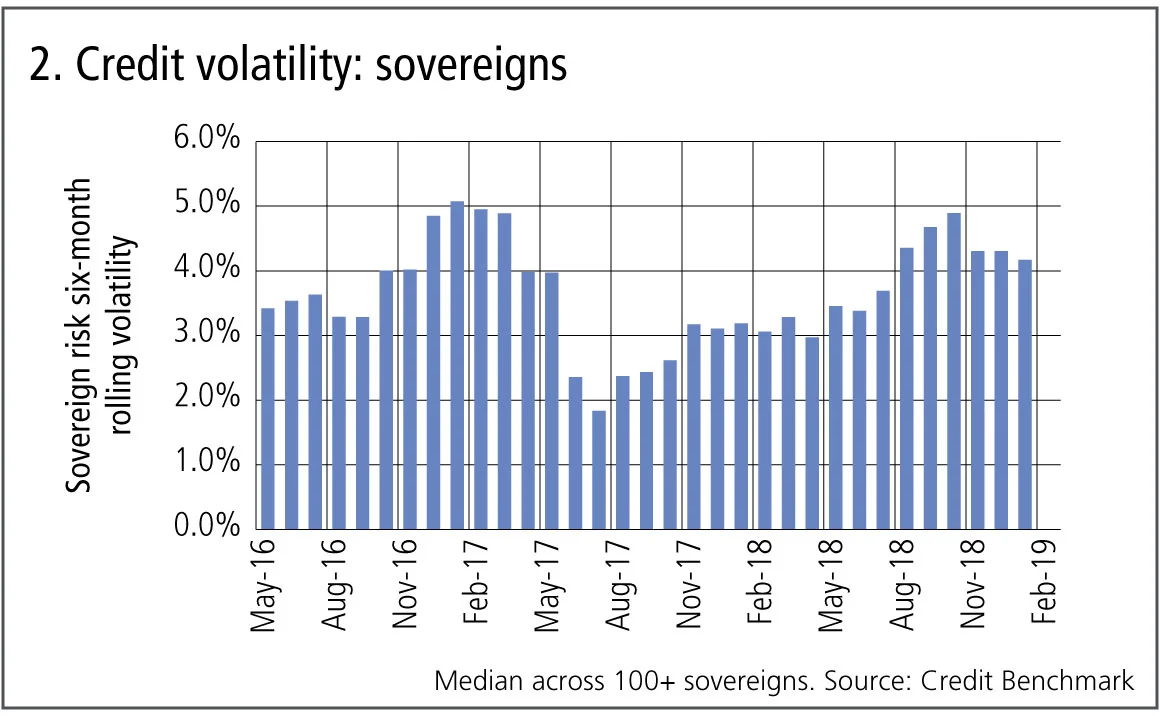
Figure 2 shows:
- Sovereign credit risk volatility peaked at the end of 2016.
- Volatility declined throughout the first six months of 2017.
- From mid-2017 to late 2018, sovereign credit volatility rose steadily and substantially.
- Credit volatility has been dropping in recent months but remains high.
Airlines
The airline industry has had some major setbacks in recent months, particularly with the unresolved problems of the Boeing 737 Max 8. Dozens of nations have grounded the plane, with immediate financial impacts for airlines and travel operators, as well as their supply chains.
Broader economic factors have hit airlines around the globe. In the UK, EasyJet warned of damage caused by Brexit uncertainty and falling consumer confidence; while the major Chinese airlines saw profits cut due to rising fuel prices and currency losses.
Figure 3 shows the credit trend and distribution of 104 airline companies around the world.
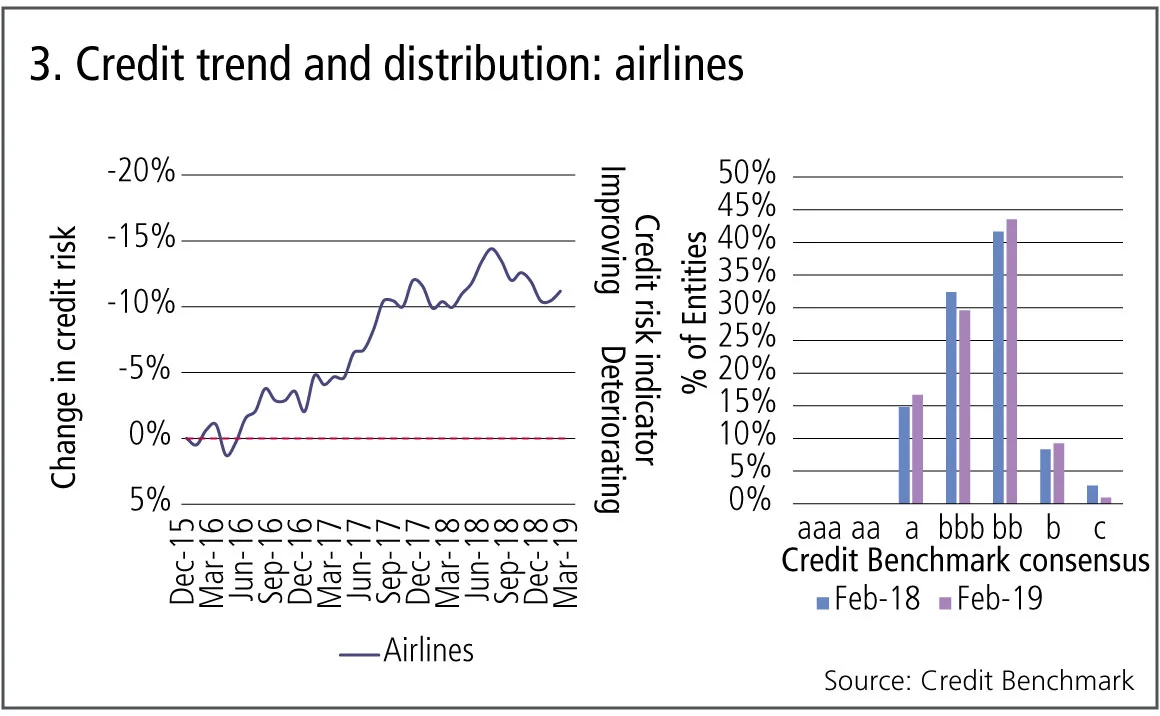
Figure 3 shows:
- Credit risk improved steadily by 15% from the beginning of 2016 to mid-2018.
- Credit quality dropped in the last quarter of 2018 by 5%.
- The majority of airlines have a Credit Benchmark consensus of bb.
- Over the past year, there has been a slight shift in distribution from bbb to a and bb categories.
Opec sovereigns
Opec has had a difficult few years. Fracking has made the US self-sufficient in oil, making it the world’s biggest oil producer. It could overtake Saudi Arabia to become the top oil exporter within five years.
Oil faces a two-way pull. The Libyan conflict has pushed prices up, but fracking has capped the long-term sustainable price. It has been difficult for Opec to maintain production cuts, with Qatar recently leaving the group. Venezuela – despite huge reserves – is in a state of near-total economic collapse. Saudi Arabia has shelved plans to float Saudi Aramco, but there was strong demand for its recent $10 billion bond.
Figure 4 shows the credit trend of 353 US large oil and gas companies and 12 Opec sovereigns.
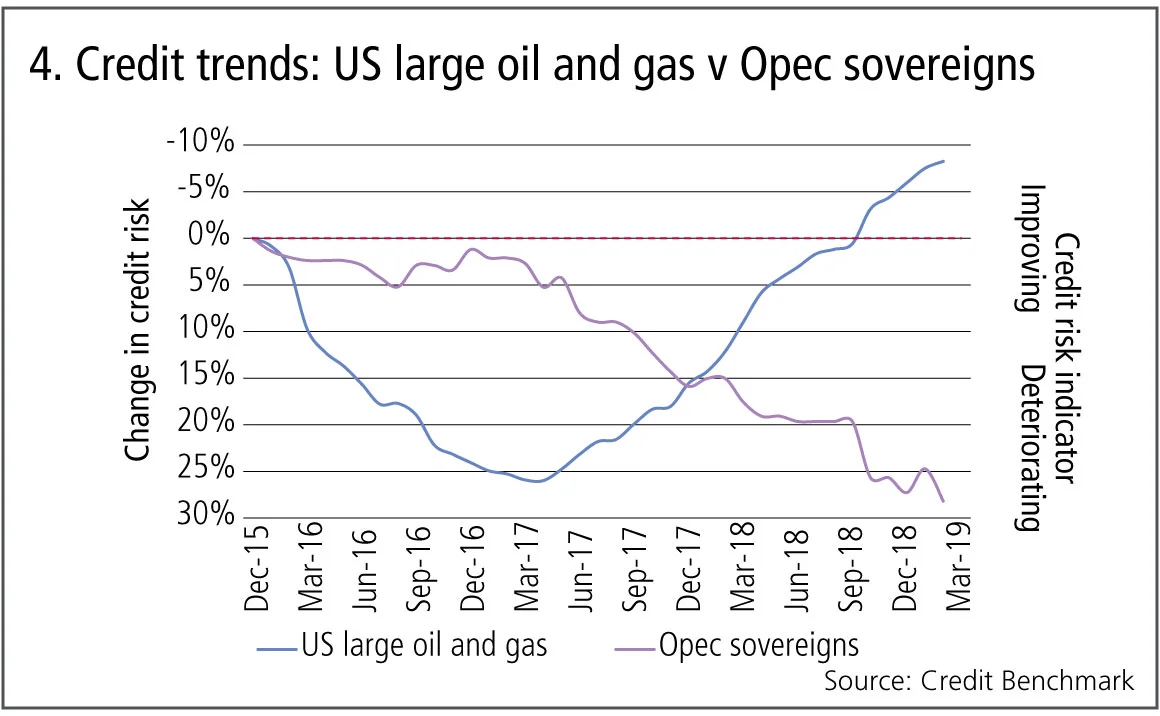
Figure 4 shows:
- US large oil and gas credit risk saw a 25% increase throughout 2016 and early 2017.
- Since then, it has been on an improving trend, dropping by nearly 30%.
- US oil and gas credit risk surpassed its December 2015 credit level in September 2018.
- Opec sovereigns’ credit risk has steadily increased from December 2016 onwards, rising by nearly 30%.
Basic materials v utilities
Basic materials and utilities have very different credit dynamics, with basic materials driven by global commodity prices while utilities are largely domestic and subject to local regulations. For this reason, the credit trends for these two industries would normally be expected to show independent or even divergent paths. Over the past few years, credit risk for utilities has indeed been less volatile; but the industries show similar turning points. The reason for this is unclear, but may reflect the impact of global infrastructure spending on the demand for basic materials. Figure 5 compares the credit trend and distribution for 1,580 basic materials and 850 utilities companies.
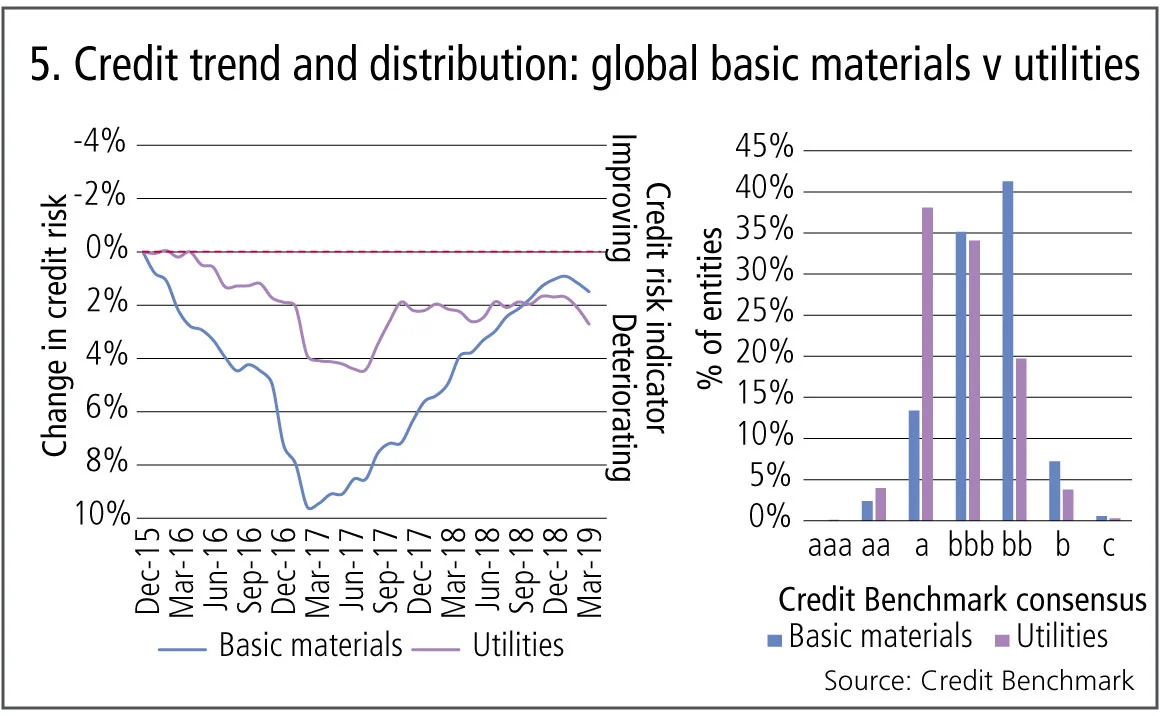
Figure 5 shows:
- Both basic materials and utilities saw an increase in credit risk until the first quarter of 2017. The decline of basic materials credit risk was much sharper with an increase of 10%, compared with 4% for utilities.
- Basic materials then saw an improvement in credit risk from March 17, followed by utilities a few months later.
- Utilities stabilised in 2018, while basic materials continued to improve.
- Recent trends show a decline in credit risk for both industries.
- Utilities are concentrated in the a/bbb categories, with more than three-quarters of entities classed as investment grade. Basic materials are evenly split between investment grade and high yield, with more than 40% having a Credit Benchmark consensus of bb.
About this data
Credit Benchmark provides the world’s most comprehensive market view of credit risk. By bringing together monthly credit risk inputs from 40-plus of the world’s leading financial institutions, Credit Benchmark provides credit trends across geographies and industries as well as a unique view of credit risk with consensus ratings on about 50,000 rated and unrated entities globally.
David Carruthers is head of research at Credit Benchmark.
Only users who have a paid subscription or are part of a corporate subscription are able to print or copy content.
To access these options, along with all other subscription benefits, please contact info@risk.net or view our subscription options here: http://subscriptions.risk.net/subscribe
You are currently unable to print this content. Please contact info@risk.net to find out more.
You are currently unable to copy this content. Please contact info@risk.net to find out more.
Copyright Infopro Digital Limited. All rights reserved.
As outlined in our terms and conditions, https://www.infopro-digital.com/terms-and-conditions/subscriptions/ (point 2.4), printing is limited to a single copy.
If you would like to purchase additional rights please email info@risk.net
Copyright Infopro Digital Limited. All rights reserved.
You may share this content using our article tools. As outlined in our terms and conditions, https://www.infopro-digital.com/terms-and-conditions/subscriptions/ (clause 2.4), an Authorised User may only make one copy of the materials for their own personal use. You must also comply with the restrictions in clause 2.5.
If you would like to purchase additional rights please email info@risk.net
More on Comment
Op risk data: Kaiser will helm half-billion-dollar payout for faking illness
Also: Loan collusion clobbers South Korean banks; AML fails at Saxo Bank and Santander. Data by ORX News

Beyond the hype, tokenisation can fix the pipework
Blockchain tech offers slicker and cheaper ops for illiquid assets, explains digital expert

Rethinking model validation for GenAI governance
A US model risk leader outlines how banks can recalibrate existing supervisory standards

Malkiel’s monkeys: a better benchmark for manager skill
A well-known experiment points to an alternative way to assess stock-picker performance, say iM Global Partner’s Luc Dumontier and Joan Serfaty

The state of IMA: great expectations meet reality
Latest trading book rules overhaul internal models approach, but most banks are opting out. Two risk experts explore why

How geopolitical risk turned into a systemic stress test
Conflict over resources is reshaping markets in a way that goes beyond occasional risk premia

Op risk data: FIS pays the price for Worldpay synergy slip-up
Also: Liberty Mutual rings up record age bias case; Nationwide’s fraud failings. Data by ORX News

What the Tokyo data cornucopia reveals about market impact
New research confirms universality of one of the most non-intuitive concepts in quant finance
