
This article was paid for by a contributing third party.More Information.
Why smart money trades spreads

By Dave Lerman, CME Group
With the unprecedented flow of volume into futures contracts, it comes as no surprise that there is a heightened interest in trading futures contracts. Liquidity, leverage, around the clock trading and potential tax advantages are among some of these great features. But one of the more useful features is the ability to spread futures contracts. Many veteran traders and professionals avail themselves to spread strategies because they offer certain features that outright long or short positions can’t.
The goal of this series is to introduce novice traders and those with less experience to the notion of spreading futures contracts. But before we get into why smart money trades spreads, lets begin with a few definitions.
A spread trade is the simultaneous purchase and sale of two futures contracts in order to take advantage of price discrepancies. There are primarily three types of spreads* with futures:
- Intra-market (aka: Calendar spread or intra-delivery) where the trader is long and short basically the same commodity futures but different expiration months. i.e. July/November soybean spread
- Inter-commodity Spread—where the trader is simultaneously long and short two different futures, such as being long the E-mini S&P 500 (large caps) and short the E-mini Russell 2000 (small caps.
- Complex Spreads—where the trader is long/short multiple legs such as Eurodollar butterflies with futures (these are different from options*) or the Soybean crush spread or the crude oil crack spread. These complex spreads are usually traded by professionals.
Pros and Cons of Spread Trading: As with any type of trading, spread trading comes with a myriad of positives and some negatives.
The first major feature is the potential to profit in both up and down markets. For example. If a trader is long WTI and Short Brent Crude at a differential of 5 (brent $5.00 premium to WTI), the trader will profit as long as the spread declines below $5.00. This can happen if prices in WTI and Brent advance or decline. As long as WTI gains on Brent, the spread will profit and the trader doesn’t have to worry about advancing or declining markets.
The second key feature is that spreading is unique to futures and as such can provide futures traders a great deal more strategies other than outright long and shorts. If a trader thought small cap stocks were going to outperform large cap stocks, the trade can be done easily and cheaply with futures. While the trade can be done with stocks or even ETFs, the capital requirement and margin would be substantially larger.
One of the best features to spread trading is they often offer margin offsets or discounts. Later in this series, we will have several examples that demonstrate the key features of margin offset. With margin offsets, traders may be able to see some cost savings. Figure 1 below lists many of the pros and cons of trading spreads with futures.
Figure 1
Pros and Cons with Spread Trading
Pros
- Provides additional trading opportunities that can’t be accomplished via outright long/short
- A bit easier to take advantage of price discrepancies than to predict out right price movement.
- You don’t have to get “market direction” correct to make money
- Margin offsets
- Can reduces risk (but even with spreads there can be risk)
- Futures and Options professionals frequently trade spreads
- Trading inter-market spreads or intra-market spreads, helps you keep a pulse on the markets as a whole markets.
- Ease of shorting futures makes strategy easier to implement
Cons
- Requires two legs, thus added transaction costs
- While risks are generally, but not always reduced, returns are as well.
*not to be confused with options spreads, where there are hundreds if not thousands of spread combinations given all the strike prices and expiration months.
Some additional items to be aware of before considering spreads
Before investors can trade spreads, they must adhere to a few “rules” and guidelines. Some spreads will be done in a 1:1 ratio. Because of differences in notional amounts, other ratios might be required. The WTI Brent Spread is executed in a 1:1 ratio. The 2 yr Treasury to 10 year Treasury spread is done 2:1 because of changes in notional value—the 2 year having a $200,000 notional and 10 year having a $100,000 notional.
Margin offsets, which can be substantial, can only be achieved if spread is done in accordance with clearing house ratios. Hence if the clearinghouse recognizes a 2:1 ratio, the margin offset will only apply if the trade is done in a 2:1 ratio. Any other ratio will require greater upfront margin.
Spread Traders should always, check CME Group’s website or check with your FCM/Broker for specifics of the spread you are interested in.
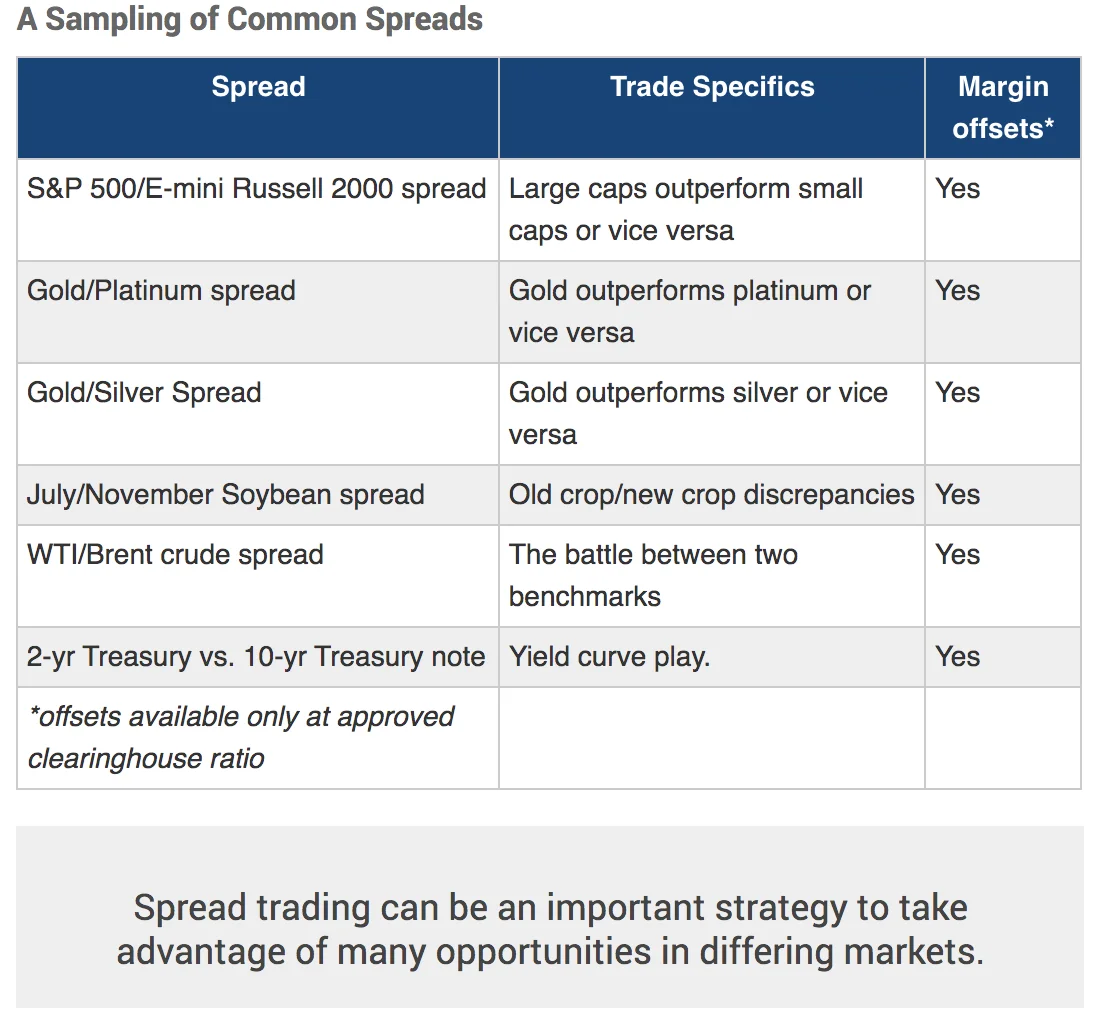
Common Spreads in Futures Trading
There are hundreds if not thousands of spread trades one can create with futures contracts. You could fill a book with seasonal and calendar spreads alone. For the current series, our objective is to introduce some of the more popular intermarket and intra-market spreads. Perhaps in another future series we will cover seasonality and calendar spreads in more detail.
In each of the four parts of this series we will cover the basics (and some details) of how these spreads are constructed, what the trader’s feedback has been and of course ratio specifics and margin offsets.
Figure 2
Over the years we have seen major shifts in the yield curve. Earlier in 2019 the yield curve flattened. It was the financial story of 2019 as some cynics were convinced a recession would follow an inversion. Then as fall/winter approached, the yield curve began to shift toward a steeper shape. Earlier in the year the 2-yr to 10-yr spread was completely flat and was heading toward inversion (it actually inverted on a couple of days) but as 2019 progressed, it steepened by 20-30 basis points. Could a spread be constructed to take advantage of this steepening? Let’s look at how such a spread is constructed, including the reasonable level of ratio and margin offset.The first spread we will cover is in the interest rate asset class. More specifically in the U.S. Treasury Complex. Spreads done in U.S. Treasuries are usually constructed to take advantage of shifts in the U.S. Treasury Yield curve. Given that CME Group has Treasury futures in the 2, 5, 10, 20 year and beyond (Ultra Treasury Bond), the complex covers much of the yield curve.
Spread Trading Along the Yield Curve—A hypothetical illustration using the 2-yr and 10-yr treasury Notes.
A trader believes that the yield curve (as measured from the 2yr to 10 yr maturities) is going to steepen from its current 1 basis point and return to levels seen earlier in the year (+20 basis points). To play this opportunity, he decides to short 10-yr T-note futures and go long 2-yr T-note futures.
What is the accepted ratio on the spread and the margin?
Current Prices (August 22, 2019)
Dec 10 year note futures
Dec 2 year note futures
= 129-28
= 107-22
Margin $1,150
Margin $540
To determine the acceptable ratio, the CME Group website has information on treasury spreads for most of the yield curve spread possibilities (see figure 3).
Figure 3: Implied Treasury Spreads and Ratios
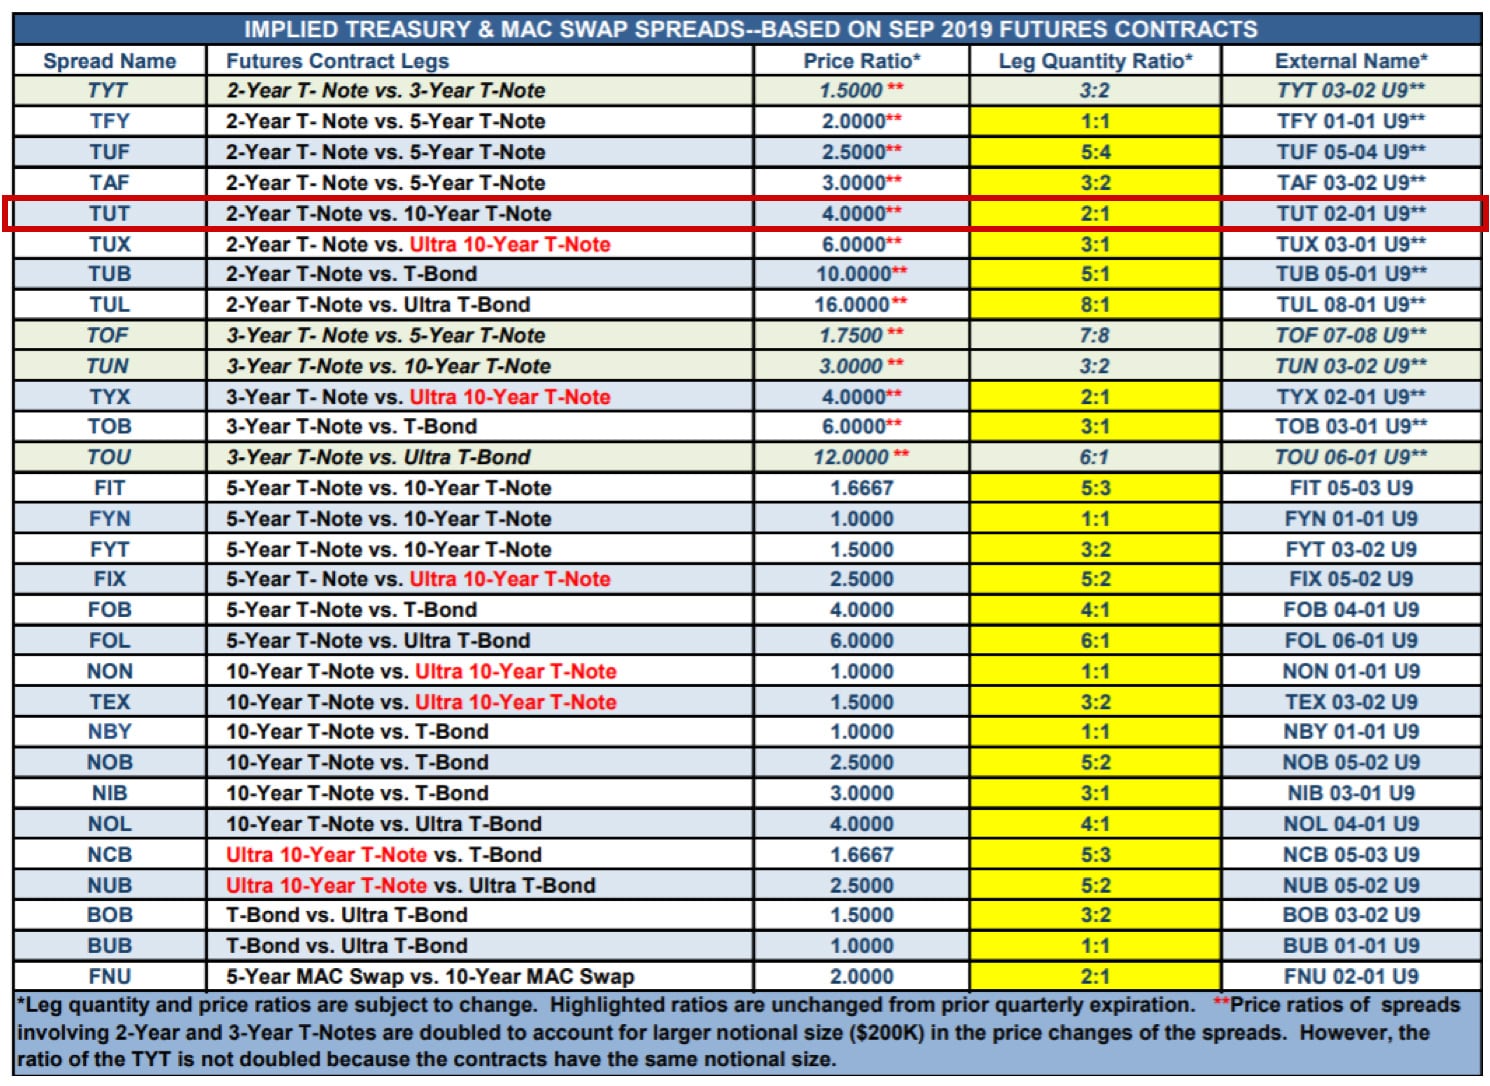
Encircled in red is the 2-Year T-note vs. 10-Year T-Note spread. The price ratio is calculated to be 4:1 (4 2-yrs contracts vs. 1 10-yr contract). However, the 2-Year T-Note contract is twice the size in notional value as the 10-Yr T-note thus lowering the ratio to 2:1. The details of the trade are laid out below.
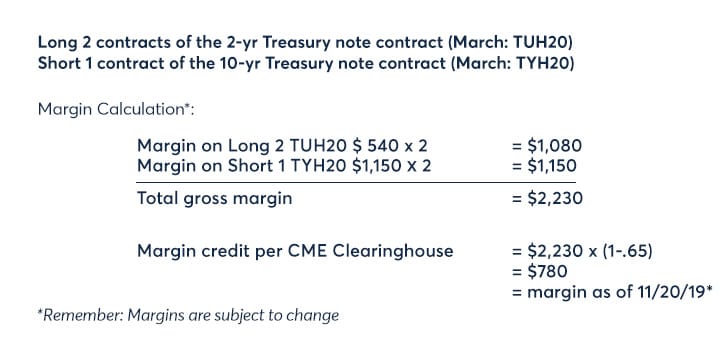
The Margin offset feature can allow the trader to do this yield curve spread for about $780.00 as opposed to the gross margin of $2,230. The savings can then allow traders to use their capital more efficiently.
Now let’s look at how the trade did and calculate the total P/L. As one can see from the graph in figure 4 below, the yield curve did in fact steepen after being close to inversion for a brief time in 2019.
Figure 4: Federal Reserve Economic Database 10 yr T-note yield minus 2-yr T-Note Yield
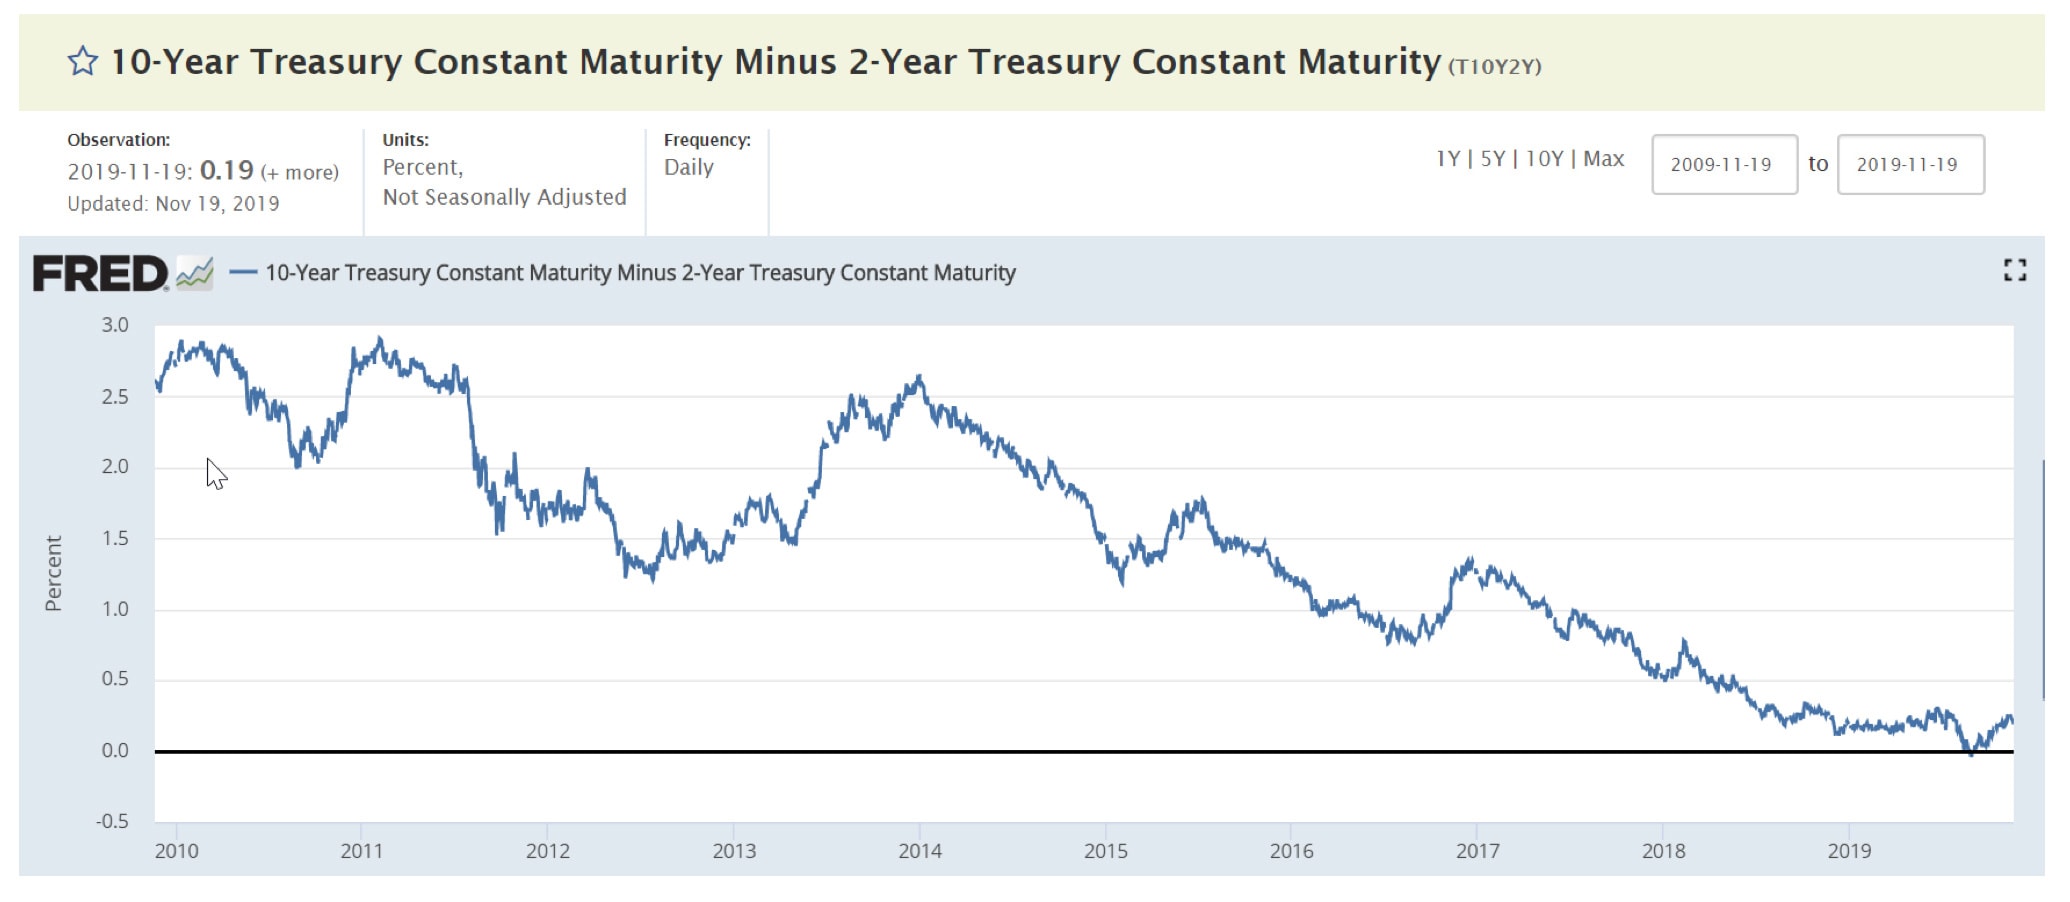
The yield differential went from 1 basis point to 19 basis points in a relatively short amount of time resulting in a profit. The long position in the 2-year leg lost money. The short position in the 10-yr T-Note gained and gained more than the 2-yr lost resulting in an overall profit on this spread. Figure 5 below has the details of each leg. (Remember too, that the 10-yr T-note future moves in ½ of 1/32nd increments while the 2-yr T-note future moves in 1/8th of 1/32nd increments. In this example the author rounded to 1/32nd for simplicity)
Minimum Tick Increments for 2 and 10 yr Treasury note futures
2-year 1/8 of 1/32nd = $7.8125 per tick ($200,000 notional value)
10-year ½ of 1/32nd = $15.625 per tick ($100,000 notional value)
Figure 5: P/L on 2-10 yr Treasury Spread
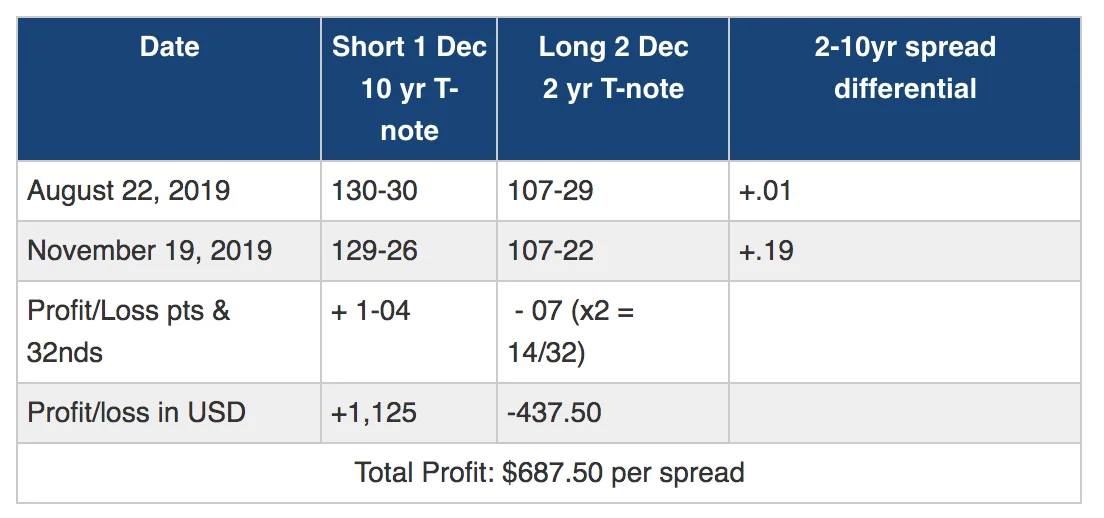
In summary, the entire curve could “yield” abundant opportunities for spread traders. In a steepening yield curve, the longer maturity bond futures generally would sell off more than the 10 year note—providing even more profit potential to the spreader.
Sponsored content
Copyright Infopro Digital Limited. All rights reserved.
As outlined in our terms and conditions, https://www.infopro-digital.com/terms-and-conditions/subscriptions/ (point 2.4), printing is limited to a single copy.
If you would like to purchase additional rights please email info@risk.net
Copyright Infopro Digital Limited. All rights reserved.
You may share this content using our article tools. As outlined in our terms and conditions, https://www.infopro-digital.com/terms-and-conditions/subscriptions/ (clause 2.4), an Authorised User may only make one copy of the materials for their own personal use. You must also comply with the restrictions in clause 2.5.
If you would like to purchase additional rights please email info@risk.net