
Monthly swaps data review: credit volumes peak in June
Global cleared credit derivatives volumes reached $1 trillion before ebbing in July

Cumulative volume of $3.5 trillion gross notional in global cleared credit derivatives over the April-July period peaked in June, with Ice capturing more than 90% of the business. This is a smaller market than the interest rate swap market, which was the main subject of my previous articles, but it is still significant in terms of volumes.
Global cleared volumes
Eighty-six per cent of global monthly cleared volumes was represented by credit default swap index (CDX). Let’s start with a chart breaking out CDX and single-name credit default swaps (CDS) by clearing house.
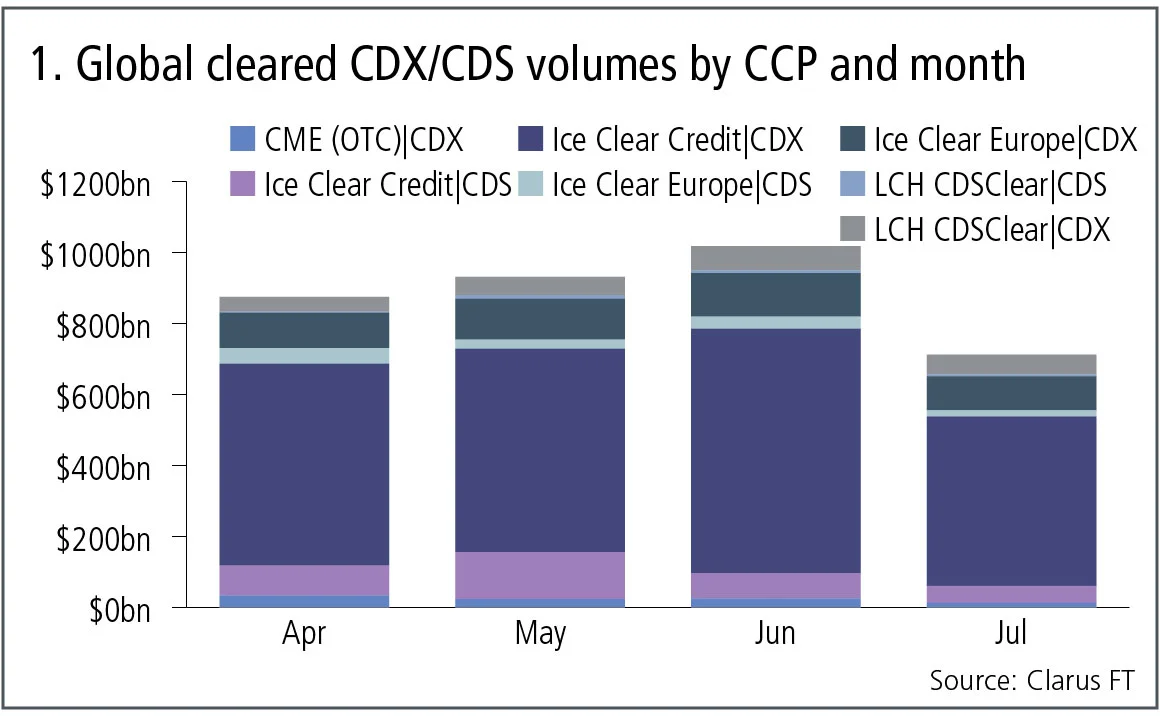
Figure 1 shows:
- Cumulative volume of $3.5 trillion gross notional in the past four months, of which the majority is CDS index ($3 trillion), and monthly volume ranging from $700 billion to $1 trillion.
- June 2017 was the highest month and July the lowest in the four-month period.
- Ice Clear Credit is by far the largest clearing house and CDX the largest product at Ice, with volume between $475–687 billion a month.
- Single-name CDS volumes at Ice Clear Credit are $48–132 billion a month.
- Ice Clear Credit represents 75% of the cumulative volume over the four-month period.
- Ice Clear Europe is the next largest and represents 16% of the cumulative volume, with monthly CDX volume of $96–123 billion and CDS volume of $18–45 billion.
- The combined share of the two Ice entities is 91% of cumulative volume.
- LCH CDSClear is the next largest with 7% market share, with CDX monthly volumes of $42–70 billion and CDS volumes of $4–11 billion.
- CME has 3% market share with CDX monthly volumes of $13–33 billion and no CDS volumes.
While these figures are much smaller than interest rate swaps where monthly volumes are $20–30 trillion, they are substantial in that almost $1 trillion gross notional is transacted and cleared each month.
Product types
Now let’s look at the same figures, but split by product type to see which types of contracts are the most traded.
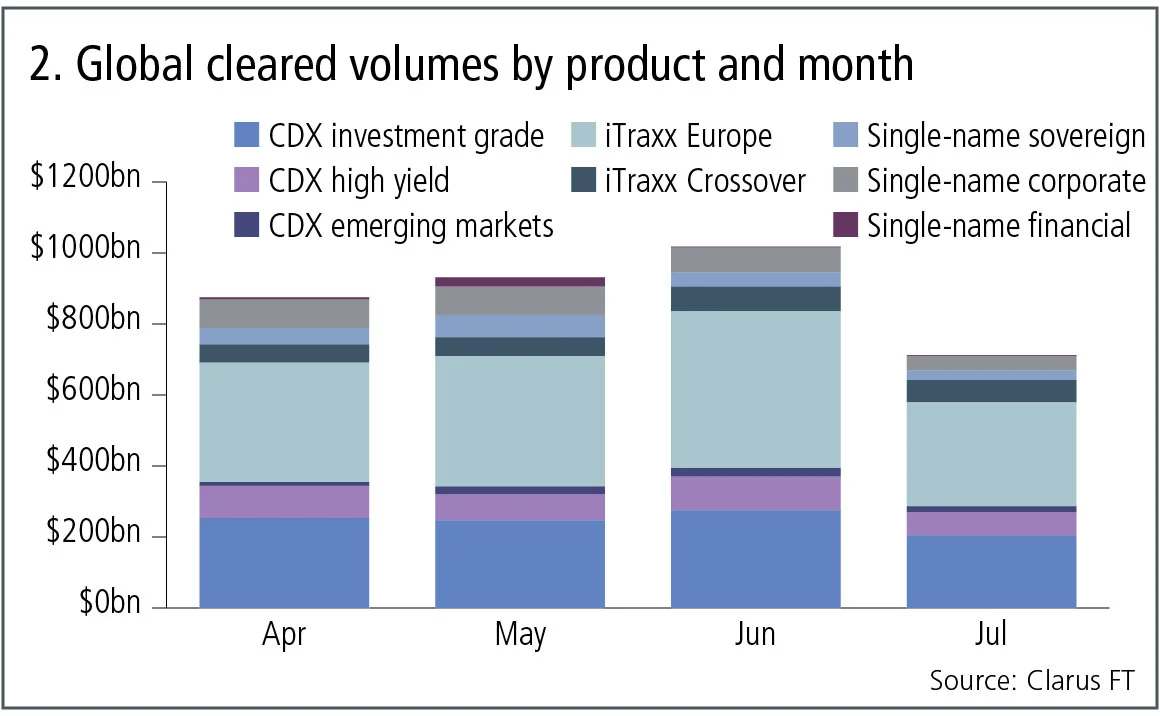
Figure 2 shows:
- iTraxx Europe is the largest product and represents 41% of the overall volume in this period with monthly volumes between $330–440 billion.
- CDX investment grade is the next largest product and represents 28% of the overall volume in this period with monthly volumes between $200–275 billion.
- CDX high-yield follows with a 9% share and monthly volumes of $65–95 billion.
- Single-name on corporates has 8% and monthly volumes of $40–80 billion, showing how much the single-name market is cleared, compared with the index market.
- Single-name on sovereigns represents 5% and single-name on financials represents 1% of the volume over this period.
- CDX emerging markets is 2% of the volume with $11–25 billion a month.
Swap execution facilities
Swap execution facilities (Sefs) are trading venues mandated for a subset of the cleared CDS index products executed by US-regulated market participants. They are required to publish daily volumes. However, single-name CDS do not fall under this regime, as they are regulated by the Securities and Exchange Commission, not the Commodity Futures Trading Commission.
Let’s look at monthly volumes over the same period for CDS index products.
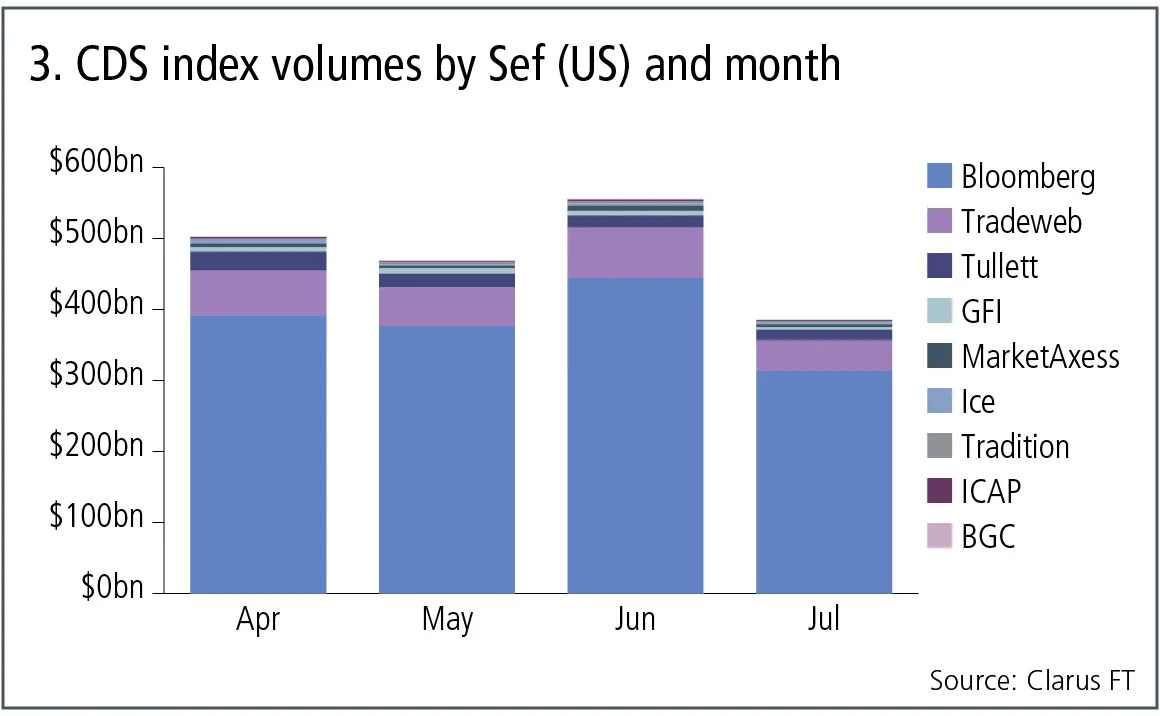
Figure 3 shows:
- Cumulative gross notional of $1.9 trillion over the four-month period, compared with the $3 trillion we saw in global cleared volumes, so representing 60% of the overall market.
- Bloomberg is by far the largest Sef, with 80% market share and monthly volumes between $300–450 billion.
- Tradeweb is the next largest with 12% share and monthly volumes between $40–70 billion.
- Tullett has a 4% share with monthly volumes between $15–30 billion.
- The remaining Sefs each have a 1% or smaller share.
Bloomberg’s dominance of trading of CDX mirrors the dominance of Ice in clearing of this asset class.
Option products
In addition to the above cleared products, there are two types of bilateral (uncleared) products that are commonly traded; options on indexes and tranches in indexes. Let’s look at the Sef reported volumes of options.
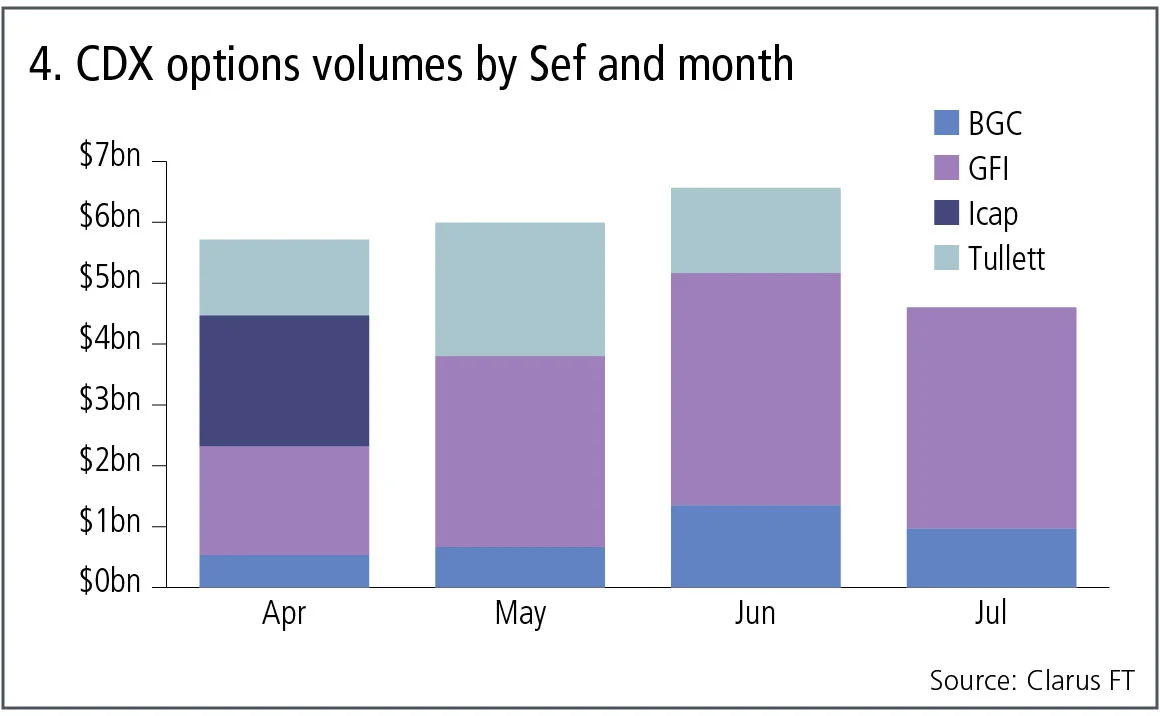
Figure 4 shows:
- Cumulative gross notional of $23 billion over the four-month period, compared with the $1.9 trillion in CDS index.
- GFI is the largest Sef with a 54% share and monthly volumes of $2–4 billion.
- Tullett is the next largest with a 21% share, followed by BGC with 15% and Icap with 9%.
So this not a huge market, but one that is active with transactions on most business days. Tranche index, however, shows very thin trading on Sefs with only $450 million reported in the four-month period, of which $380 million was at GFI.
Trade executions
A final chart before we end. Using swap data repository data we can isolate the prices of trades for a specific contract on a given business day. Let’s do so for CDX North American Investment Grade S28 (CDX.NA.IG.S28).
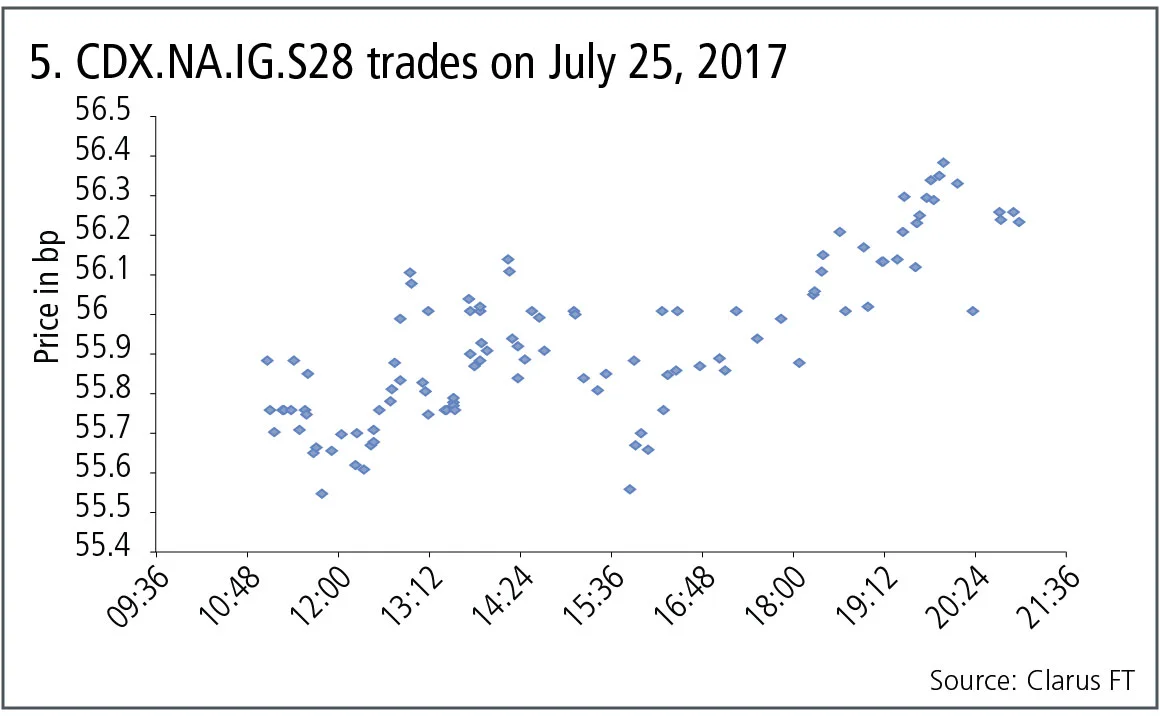
Figure 5 shows:
- The prices and times of trades executed between 11:00 universal time (UTC) and 21:00 UTC.
- 107 trades in total.
- Prices starting at 55.75 basis points and rising over the day to close at 56.25bp.
- Reasonable price volatility over the course of the trading day.
Amir Khwaja is chief executive of Clarus Financial Technology.
Only users who have a paid subscription or are part of a corporate subscription are able to print or copy content.
To access these options, along with all other subscription benefits, please contact info@risk.net or view our subscription options here: http://subscriptions.risk.net/subscribe
You are currently unable to print this content. Please contact info@risk.net to find out more.
You are currently unable to copy this content. Please contact info@risk.net to find out more.
Copyright Infopro Digital Limited. All rights reserved.
As outlined in our terms and conditions, https://www.infopro-digital.com/terms-and-conditions/subscriptions/ (point 2.4), printing is limited to a single copy.
If you would like to purchase additional rights please email info@risk.net
Copyright Infopro Digital Limited. All rights reserved.
You may share this content using our article tools. As outlined in our terms and conditions, https://www.infopro-digital.com/terms-and-conditions/subscriptions/ (clause 2.4), an Authorised User may only make one copy of the materials for their own personal use. You must also comply with the restrictions in clause 2.5.
If you would like to purchase additional rights please email info@risk.net
More on Comment
Podcast: Gordon Lee on how junior quants can go from newbie to MVP
Prioritising tasks and setting boundaries are key to career progression, says BNY’s head quant

Italy’s spread problem is not (always) a credit story
Occasional doubts over Italy’s role in the monetary union adds political risk premium, argues economist

Markets never forget: the lasting impression of square-root impact
Jean-Philippe Bouchaud argues trade flows have a large and long-term effect on asset prices

Podcast: Pietro Rossi on credit ratings and volatility models
Stochastic approaches and calibration speed improve established models in credit and equity

Op risk data: Kaiser will helm half-billion-dollar payout for faking illness
Also: Loan collusion clobbers South Korean banks; AML fails at Saxo Bank and Santander. Data by ORX News

Beyond the hype, tokenisation can fix the pipework
Blockchain tech offers slicker and cheaper ops for illiquid assets, explains digital expert

Rethinking model validation for GenAI governance
A US model risk leader outlines how banks can recalibrate existing supervisory standards

Malkiel’s monkeys: a better benchmark for manager skill
A well-known experiment points to an alternative way to assess stock-picker performance, say iM Global Partner’s Luc Dumontier and Joan Serfaty
